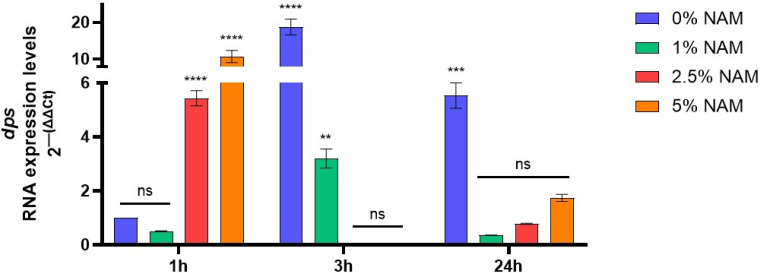
Figure 6.
E. coli dps RNA expression levels during incubation with 0–5% niacinamide, at various cell cycle stages, logarithmic phase of 1 h, stationary phase of 3 h and following 24 h. dps gene expression was assessed against the 16S rRNA housekeeping gene. Data are presented as 2−ΔΔCT normalized expression levels to the 0% negative control treatment at 1 h, ± SD. Significant differences are indicated in the graph (p-value **** < 0.0001, *** < 0.001, ** < 0.01, ns = not significant).

