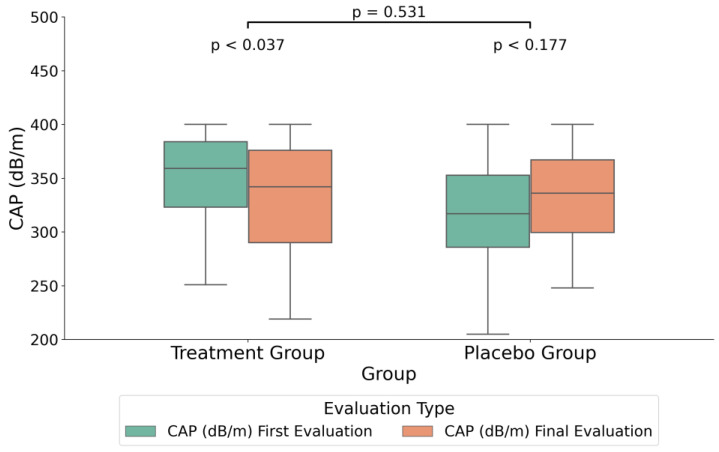
Figure 2.
Boxplot illustrating the median differences in controlled attenuation parameter (CAP) measurements (dB/m) between the treatment and placebo groups. The plot includes the CAP values at both the initial measurement and the final treatment measurement. The boxplot visualizes the interquartile range (IQR) with the median, and the whiskers indicate the minimum and maximum values within 1.5 times the IQR from the lower and upper quartiles. Outliers are represented as individual points beyond the whiskers.

