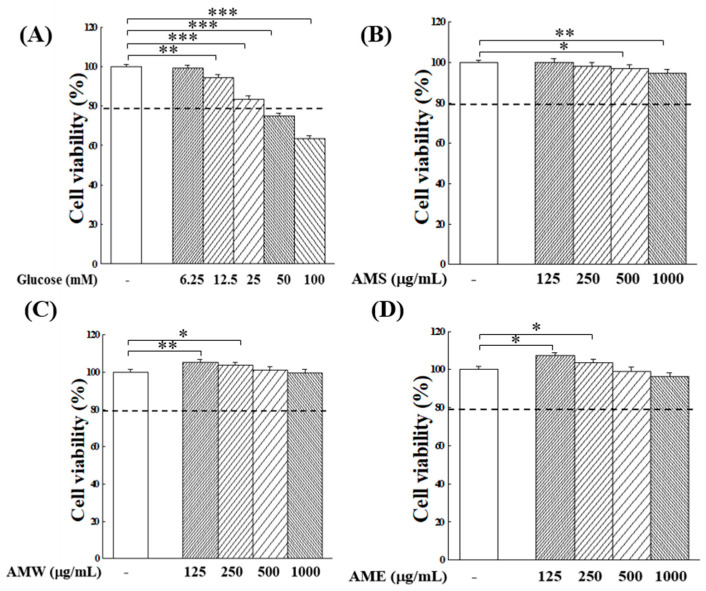
Figure 3.
Effects of varying concentrations of glucose (A), AMS (B), AMW (C), and AME (D) on the proliferation of RIN-m5f β-cells. The control group consisted of untreated RIN-m5f cells, with the cell count after incubation set at 100%. The dashed line is the auxiliary line for judgment and represents 80% survival rate. Data were collected from five independent experiments. Statistical differences were determined using one-way ANOVA test. Levels of significance are indicated as * p < 0.05, ** p < 0.01, *** p < 0.001.

