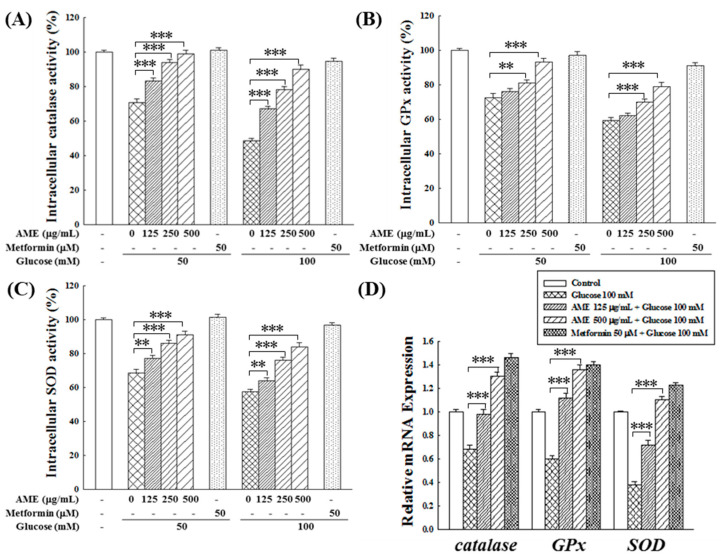
Figure 6.
Effects of AME treatment on the intracellular activity of catalase (A), GPx (B), SOD (C), and the gene expression of these enzymes (D). Data were collected from five independent experiments. Statistical differences were determined using one-way ANOVA test. Levels of significance are indicated as ** p < 0.01, and *** p < 0.001.

