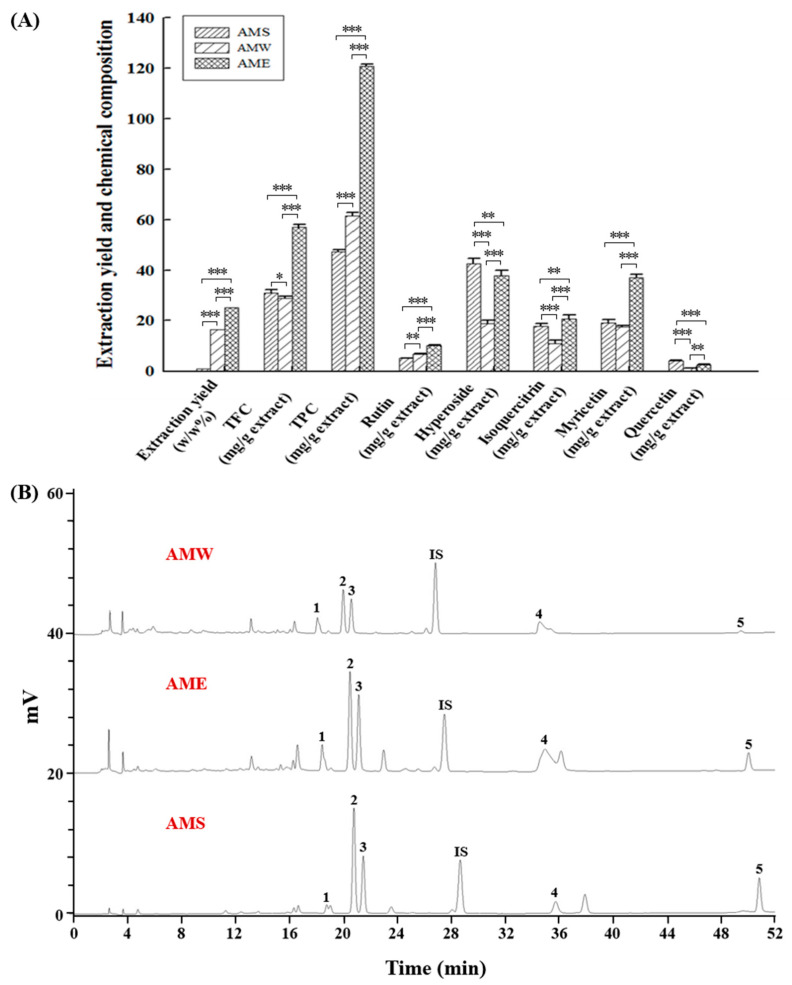
Figure 8.
Quantitative measurement of the chemical constitution of the three AMf extracts. (A) Quantification of TFC, TPC, and individual components. (B) HPLC chromatogram depicts distinct peaks representing rutin (peak 1), hyperoside (peak 2), isoquercitrin (peak 3), myricetin (peak 4), quercetin (peak 5), and the internal standard naringin (peak IS). Compound identification and quantification were conducted using authentic standards (Sigma-Aldrich). Experimental data were obtained from three repeated experiments. Statistical differences were determined using one-way ANOVA test, with significance levels indicated as * p < 0.05, ** p < 0.01, *** p < 0.001.

