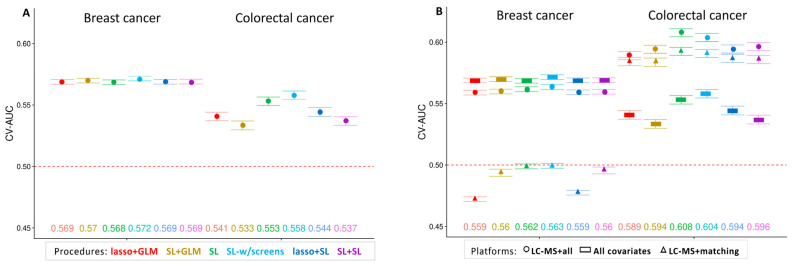
Figure 1.
Cross-validated area under the receiver operating characteristic curve (CV-AUC) averaged over 100 Monte Carlo replications of each variable selection + regression procedure for predicting breast cancer and colorectal cancer, with 95% confidence intervals (CIs). (panel A) an analysis using only the covariates. (panel B) analyses using covariates only (circles), LC-MS metabolites + base set of covariates (triangles), and LC-MS metabolites + all covariates (squares). Point estimates of CV-AUC are provided at the bottom of each panel (on the right-hand panel, the point estimates correspond to the LC-MS metabolites + all covariates analysis).

