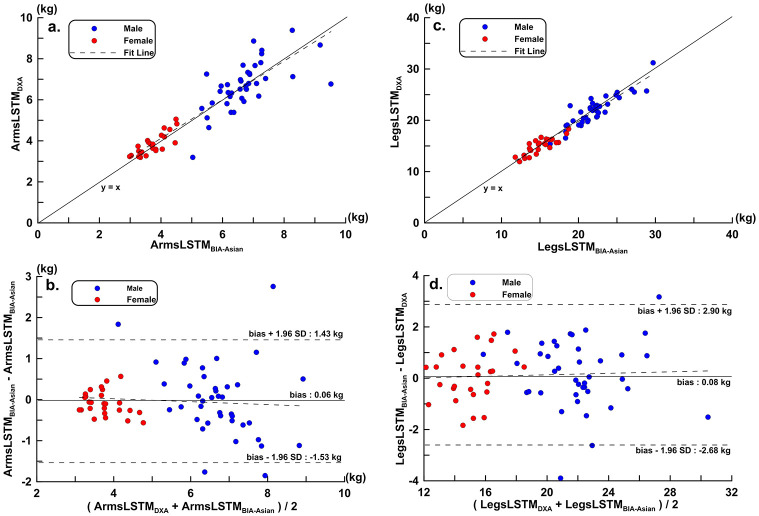
Fig 3. A new equation was developed to measure the outcomes of Asian athletes compared with DXA in the validation group (VG).
a. scatter plots and regression line of ArmsLSTM (y = 0.024 + 1.007 x, r = 0.924, p < 0.001, CCC = 0.913); b. Bland-Altman Plots of ArmsLSTM (Trend: y = 0.441–0.088 x, p > 0.05); c. Scatter plots and regression line of LegsLSTM (y = -0.094 + 1.000 x, r = 0.957, p < 0.001, CCC = 0.943); d. Bland-Altman Plots of LegsLSTM (trend: y = 0.978–0.04 x, p > 0.05).

