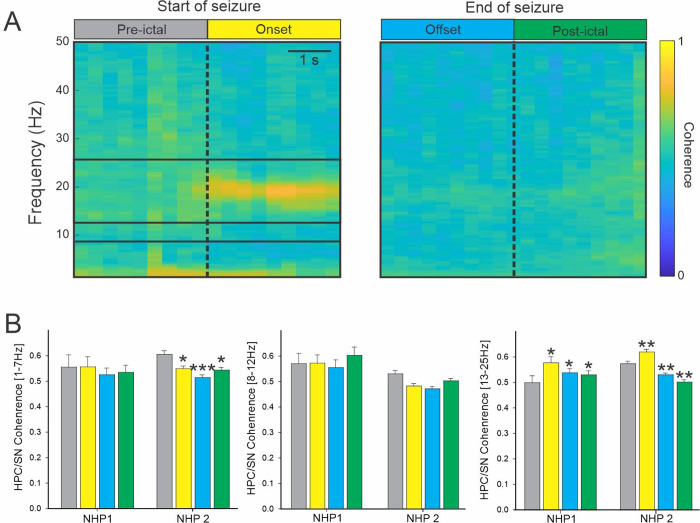
Fig 3. Coherence between HPC and SN during seizures.
(A) Colormap representation of the averaged HPC/SN coherence obtained for NHP 2 at the start and end of the seizure. (B) The averaged HPC/SN coherence for NHP 1 and 2. Results are mean ± SEM. Statistical comparisons were performed with a Friedman repeated test and Tuckey for post hoc comparison with the values preceding the seizures, *<0.05, **<0.01, ***<0.001.

