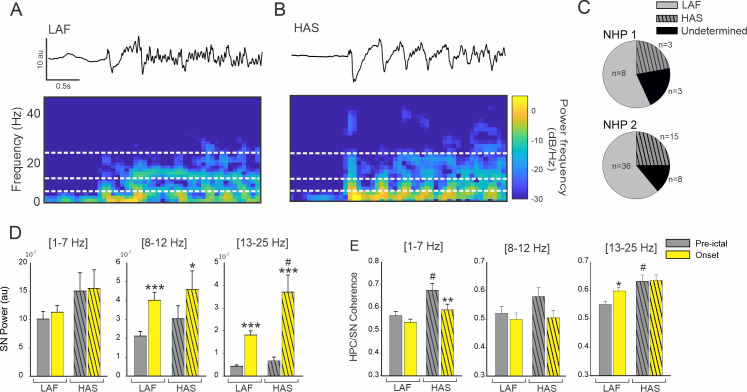
Fig 4. Effect of seizure onset pattern on HPC/SN activity.
Example of typical LAF (A) and HAS (B) seizure showing HPC recording and corresponding spectral power. (C) Percentage of LAF, HAS, and undetermined seizures for NHP 1 and 2. (D) Changes in the averaged SN power and (E) HPC-SN coherence for LAF and HAS seizures. Results are mean ± SEM. Statistical testing for comparison of pre-ictal and onset periods was performed with a Wilcoxon signed rank test, *<0.05, **<0.01, ***<0.001. Comparisons between LAF and HAS seizures were performed with a Mann-Whitney Rank Sum test, # <0.05. Statistical values were corrected for multiple comparisons using the Bonferroni method.

