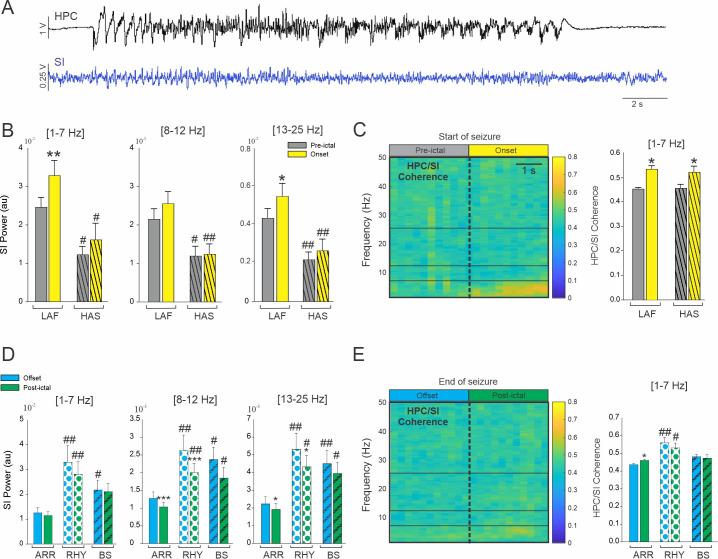
Fig 6. Influence of temporal lobe seizure onset and offset pattern on cortical activity.
(A) Example of simultaneous recordings obtained from the HPC and the SI in NHP 2. (B) Changes in the averaged SI power for LAF and HAS seizures. (C) Colormap of the averaged HPC/SI coherence (LAF and HAS combined) and changes in the averaged HPC/SI coherence in the 1–7 Hz for LAF and HAS seizures. (D) Changes in the averaged SI power for ARR, RHY and BS seizures. (C) Colormap of the averaged HPC/SI coherence (LAF and HAS combined) and changes in the averaged HPC/SI coherence in the 1–7 Hz for LAF and HAS seizures. Results are mean ± SEM. Statistical comparisons between pre-ictal vs onset and offset vs postictal were performed with Wilcoxon signed rank test *<0.05, **<0.01 and ***<0.001. Comparisons between LAF and HAS seizures were performed with a Mann-Whitney Rank Sum test, and comparison between ARR, RHY and BS were performed with an ANOVA on rank and Dunn’s Post hoc test # <0.05, ##<0.01. Statistical values were corrected for multiple comparison using the Bonferroni method.

