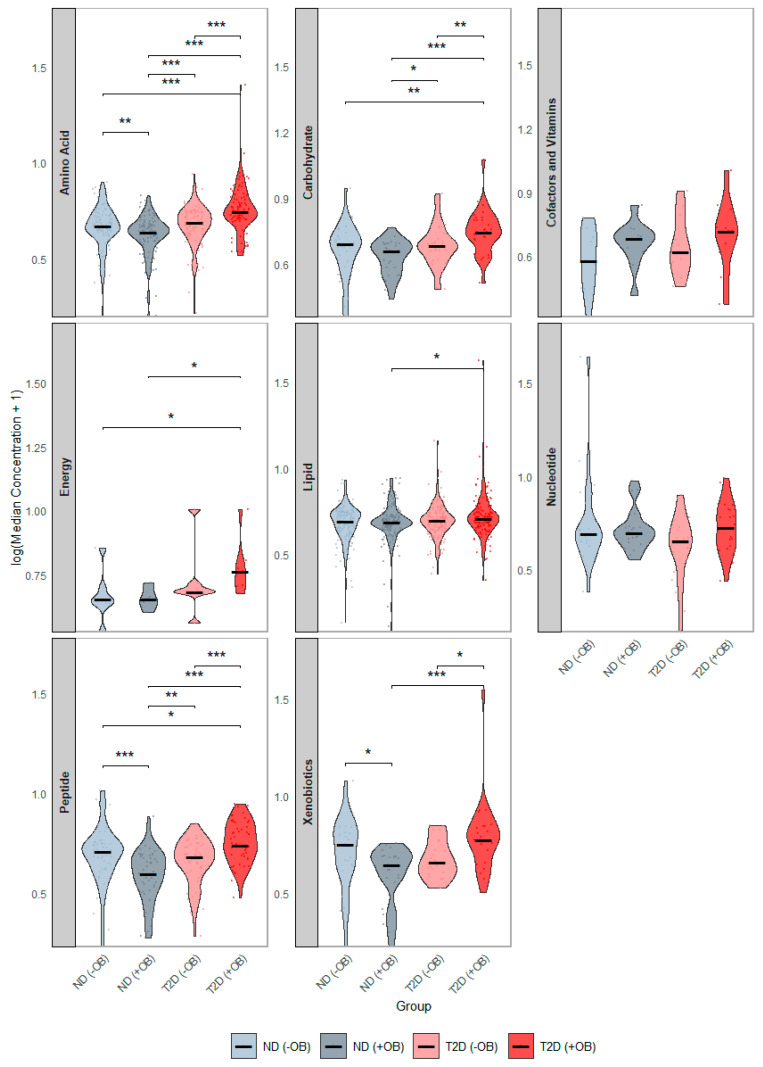
Figure 2.
Distribution of Median Metabolite Concentrations across groups defined by Diabetes and Obesity Status. This figure presents violin plots showing the distribution of median metabolite concentrations across the groups defined by T2D and Obesity status. Each panel represents the distribution of a separate metabolic category. The four groups are annotated with distinct colors: subjects without Type 2 Diabetes (T2D) and without obesity (ND −OB), subjects without T2D but with obesity (ND +OB), subjects with T2D but without obesity (T2D −OB), and subjects with both T2D and obesity (T2D +OB). Significant Wilcoxon rank-sum tests are indicated as follows: * p < 0.05; ** p < 0.01; *** p < 0.001.

