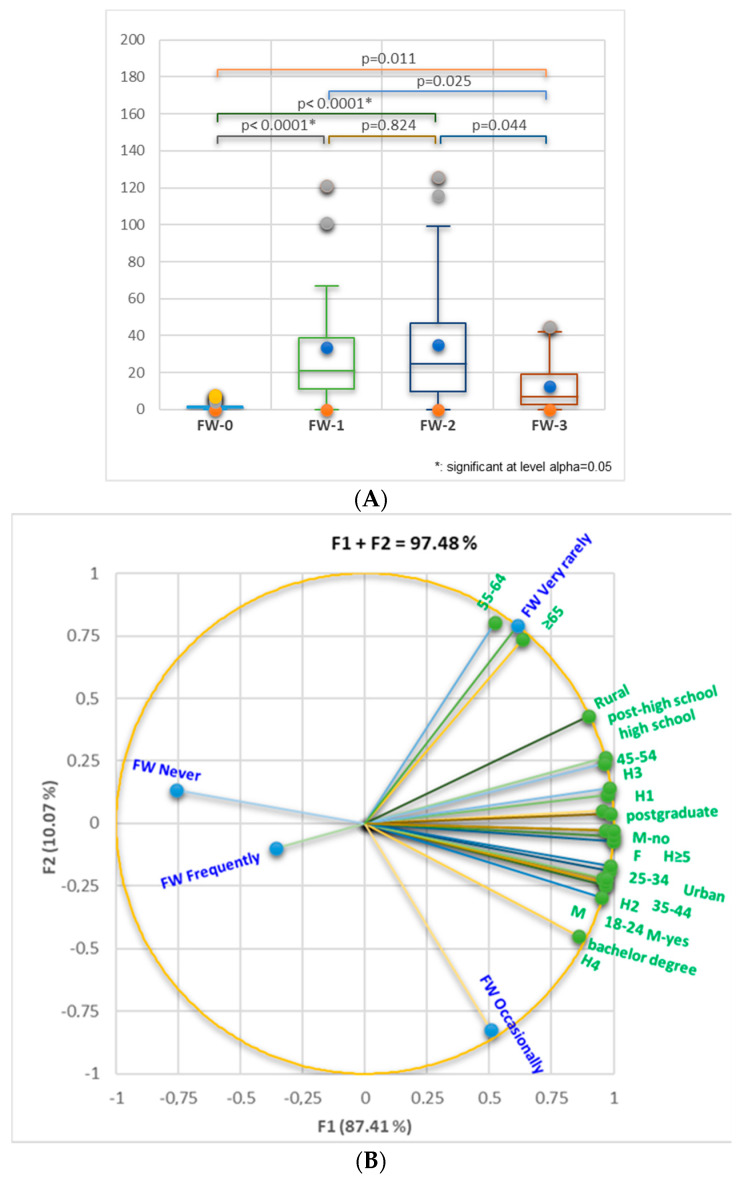
Figure 2.
(A) Kruskal–Wallis analysis for FW-0, FW-1, FW-2, and FW-3 comparison considers general data of respondents. Bonferroni-corrected significance level = 0.0083. (B) Correlation between age groups (18–24, 25–34, 35–44, 45–54, 55–64, ≥65), gender (male (M)/female (F)), education level (high school, residence, number of household members (H1—H ≥ 5), the presence of children (minors <18 years, M-yes/M-no), residence (rural/urban), and the FW-level (FW-0—FW-3).

