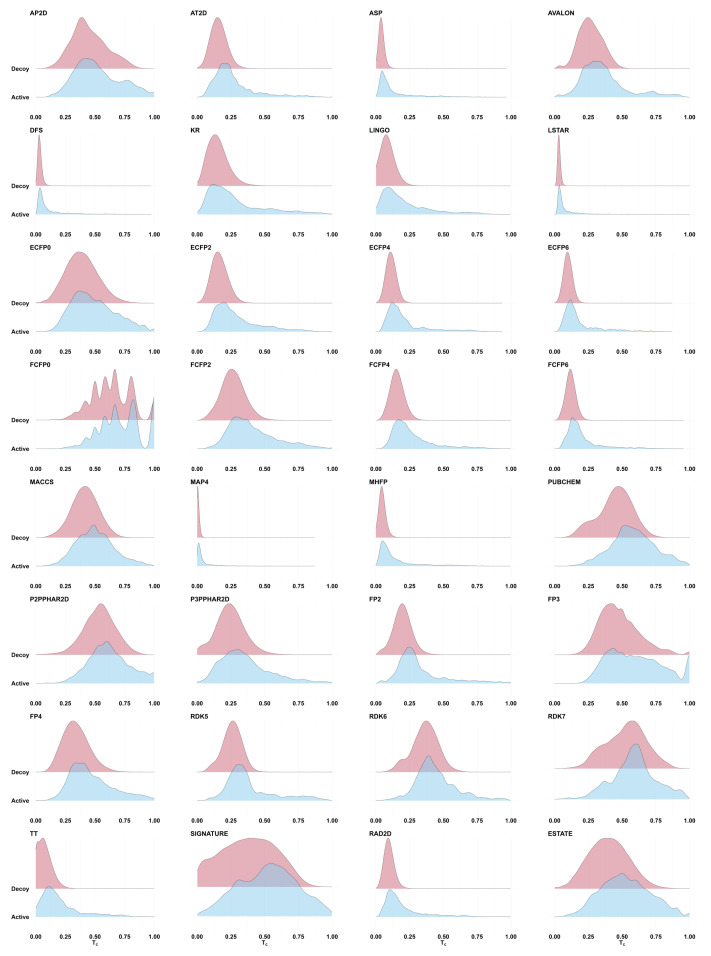
Figure 1.
Ridgeline plots showing the distribution of the Tanimoto fingerprint similarities calculated between a randomly selected active molecule for each target protein and all other actives (shown in blue) and decoys (in red) for that target. Data taken from the DEKOIS data set. The distribution of similarity scores between the active query and other active molecules is largely indistinguishable from the distribution of similarity scores to random molecules. Where the active (blue) distribution does show a fatter high-scoring tail than the inactive distribution (suggesting potential for early enrichment by using a high score threshold), a search against a large target database will still produce filtered sets that are massively dominated by inactives (see text).

