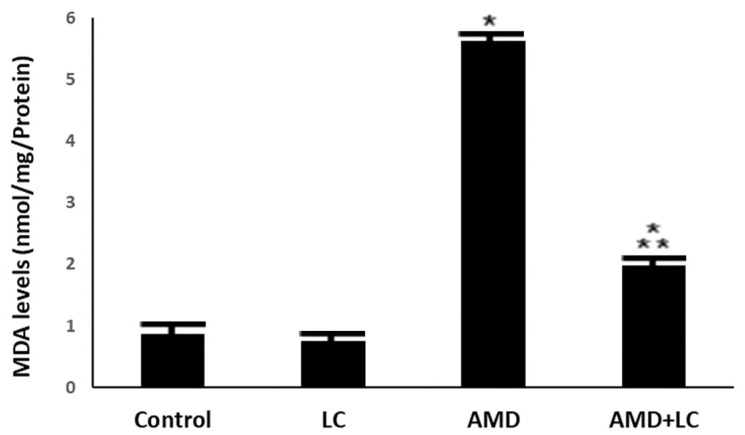
Figure 4.
The levels of MDA in the studied groups. The increased MDA levels in the AMD group are significantly reduced when LC is added to the AMD group. One-way ANOVA followed by Tukey’s post hoc test was used for comparison between different groups. * p < 0.05 compared to the controls and  p < 0.05 in comparison to the AMD group.

