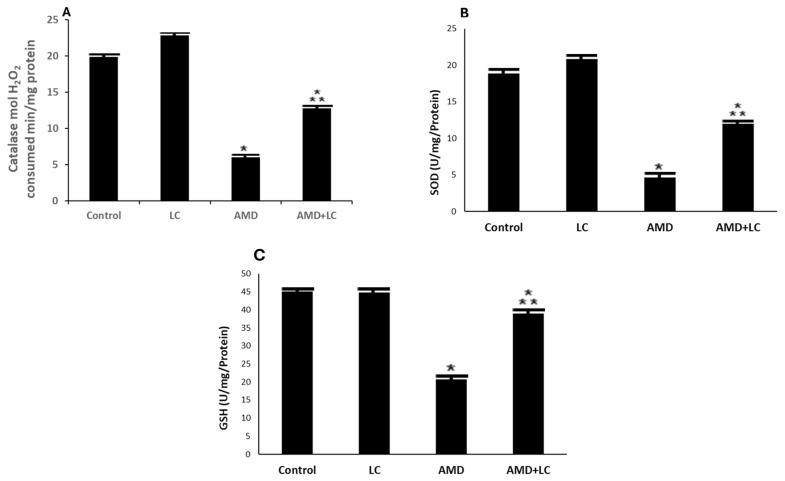
Figure 5.
AMD group’s CAT (A), SOD (B), and GPX (C) activity was lower than that of the control group. The AMD group’s CAT and SOD activity significantly increased after LC administration. Data are represented as mean ± SD; n = 6. One-way ANOVA followed by Tukey’s post hoc test was used for comparison between different groups. * p < 0.05 compared to the controls;  p < 0.05 in contrary to the AMD group. CAT: catalase; SOD: superoxide dismutase GPX: glutathione peroxidase.

