. 2024 Aug 28;13:RP93978. doi: 10.7554/eLife.93978

Figure 1. Activation of SS04185 inhibits rolling evoked by activation of Basin neurons.

(A) Schematic of Drosophila larval escape behavior sequence. (B) Ethograms of Basin activation (top panel) and co-activation of SS04185 and Basins (bottom panel). Each row represents an individual larva. Pink, blue, green, orange, and purple lines represent bouts of rolling, turning, crawling, backward crawling, and hunching. The red bar and dashed lines indicate the time window during which neural activation was present. Genotypes: 20xUAS-IVS-CsChrimson::mVenus/+;+; R72F11-Gal4/+ (top); 20xUAS-IVS-CsChrimson::mVenus/+; R54B01-Gal4.AD/+; R46E07-Gal4.DBD/ R72F11-Gal4 (bottom). Genotypes in (C, D, F–I) are the same as those mentioned here. (C) Time series of larval crawling speed during co-activation of SS04185 and Basins (red) and activation of Basins alone (black). Shaded areas represent the standard error. The red bar and dashed lines denote the optogenetic stimulation window. (D) Time series of rolling probabilities of larvae during co-activation of SS04185 and Basins (red) and activation of Basins alone (black). Shaded areas represent 95% confidential intervals for rolling probabilities. The red bar and dashed lines denote the optogenetic stimulation window. (E) Rolling probabilities of larvae with activation of different neurons. Error bars represent the 95% confidence interval. Genotypes from left to right: (1) 20xUAS-IVS-CsChrimson::mVenus/+;;, (2) 20xUAS-IVS-CsChrimson::mVenus/+; R54B01-Gal4.AD/+; R46E07-Gal4.DBD/+, (3) 20xUAS-IVS-CsChrimson::mVenus/+;; R72F11-Gal4/+, and (4) 20xUAS-IVS-CsChrimson::mVenus/+; R54B01-Gal4.AD/+; R46E07-Gal4.DBD/ R72F11-Gal4. n = 120, 118, 231, 155 from left to right. Statistics: Chi-square test, χ2 = 0, p > 0.05 for the first two groups; χ2 = 83.85, p < 0.001 for the last two groups; and χ2 = 365.51, p < 0.001 for the comparison between the first two groups and the last two groups. (F) Cumulative plot of rolling duration. Statistics: Mann–Whitney U test, p < 0.001, n = 652, 120. (G) A violin plot showing start of first rolling bout for each larva during stimulation. Statistics: Mann–Whitney U test, p = 0.027, n = 225, 89. (H) A violin plot displaying end of first rolling bout for each larva during stimulation. Statistics: Mann–Whitney U test, p < 0.001, n = 225, 89. (I) A violin plot presenting start of first crawling bout for each larva during stimulation. Statistics: Mann–Whitney U test, p < 0.001, n = 214, 70. ***p < 0.001.

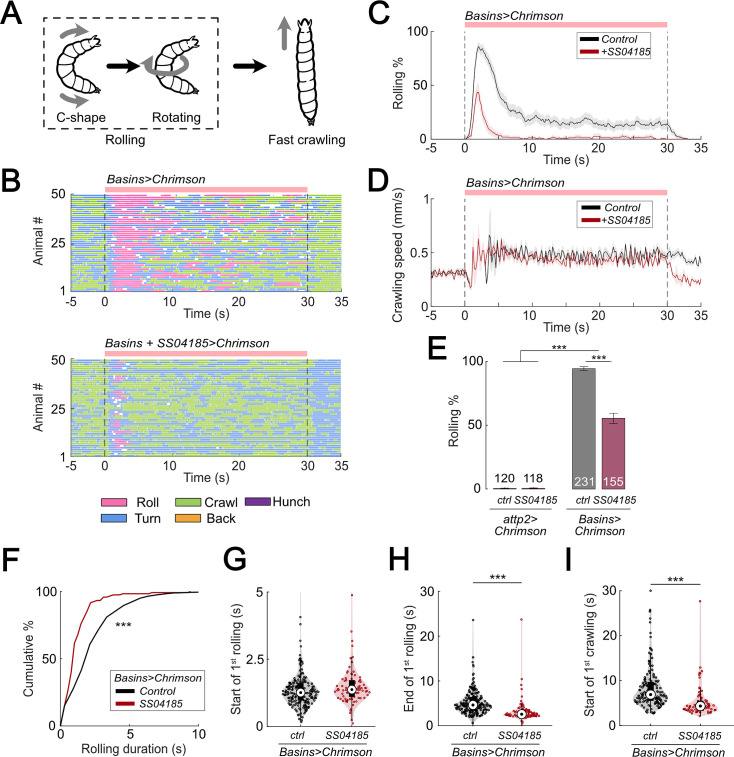
Figure 1—source data 1. Excel sheet containing statistics data from behavior tracking depicted in Figure 1E-I.
Figure 1—source data 2. Excel sheet containing raw data from behavior tracking depicted in Figure 1E-I.

Figure 1.

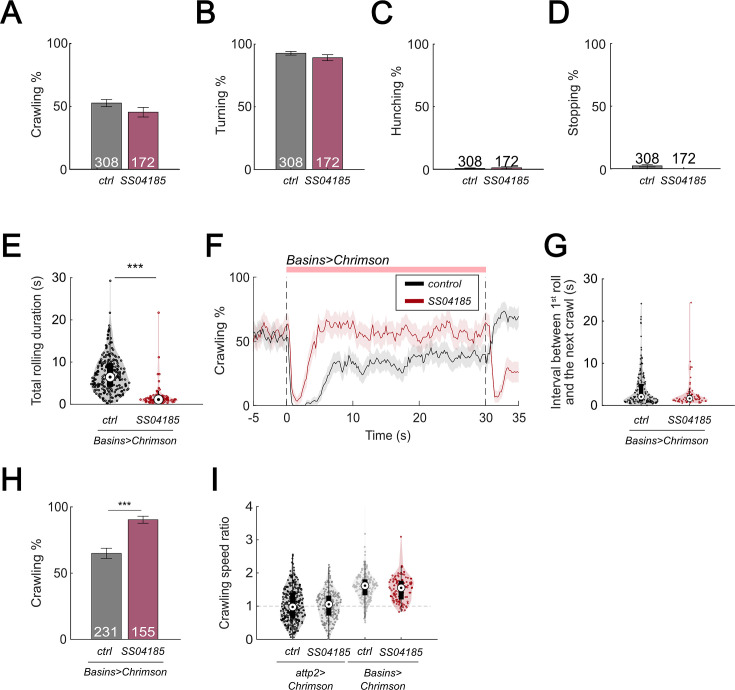
Figure 1—figure supplement 1. Activation of SS04185 inhibits rolling.

Figure 1—figure supplement 1.

(A) Crawling probabilities of larvae with the activation of SS04185-expressing neurons. Error bars, 95% confidence interval. Genotypes: 20xUAS-IVS-CsChrimson::mVenus/+;; (black); 20xUAS-IVS-CsChrimson::mVenus/+; R54B01-Gal4.AD/+; R46E07-Gal4.DBD/+ (red). Genotypes in (B–D) are the same as shown here. n = 308, 172. Statistics: Chi-square test, χ2 = 2.32, p > 0.05. (B) Turning probabilities of larvae with activation of SS04185-expressing neurons. Error bars, 95% confidence interval. n = 308, 172. Statistics: Chi-square test, χ2 = 1.77, p > 0.05. (C) Hunching probabilities of larvae with activation of SS04185-expressing neurons. Error bars, 95% confidence interval. n = 308, 172. Statistics: Chi-square test, χ2 = 0.35, p > 0.05. (D) Stopping probabilities of larvae with activation of SS04185-expressing neurons. Error bars, 95% confidence interval. n = 308, 172. Statistics: Chi-square test, χ2 = 3.97, p = 0.046. (E) A violin plot of total time spent rolling for each individual larva during stimulation. Statistics: Mann–Whitney U test, p < 0.001, n = 225, 89. (F) Time series of crawling probabilities of SS04185 and Basin co-activation larvae (green) and Basin activation only larvae (black). Shaded areas show 95% confidential intervals of the crawling probabilities. Dashed lines display the window of optogenetic stimulation. Genotypes: 20xUAS-IVS-CsChrimson::mVenus/+; +; R72F11-Gal4/+ (control); 20xUAS-IVS-CsChrimson::mVenus/+; R54B01-Gal4.AD/+; R46E07-Gal4.DBD/R72F11-Gal4 (SS04185). Genotypes in (G–H) are the same as mentioned here. n = 228, 124. (G) A violin plot of interval between first roll and next crawl. Statistics: Mann–Whitney U test, p > 0.05, n = 151, 74. (H) Crawling probabilities of SS04185 and Basin co-activation larvae (red) and Basin activation only larvae (black). Error bars, 95% confidence interval. n = 228, 124. Statistics: Chi-square test, χ2 = 28.36, p < 0.001. (I) A violin plot of crawling speed ratio of larvae with null, SS04185 neuron, Basin, SS04185 neuron and Basin activation (from left to right). Crawling speed ratio = crawling speed 5–10 s after stimulation onset/crawling speed 0–5 s before stimulation onset. Statistics: Kruskal–Wallis test: H = 144, p < 0.001; Bonferroni-corrected Mann–Whitney U test: p > 0.05 for two groups on the left and two groups on the right. n = 308, 172, 227, 124. Genotypes from left to right: (1) 20xUAS-IVS-CsChrimson::mVenus/+;;; (2) 20xUAS-IVS-CsChrimson::mVenus/+; R54B01-Gal4.AD/+; R46E07-Gal4.DBD/+; (3) 20xUAS-IVS-CsChrimson::mVenus/+;; R72F11-Gal4/+; (4) 20xUAS-IVS-CsChrimson::mVenus/+; R54B01-Gal4.AD/+; R46E07-Gal4.DBD/R72F11-Gal4. ***p < 0.001.
Figure 1—figure supplement 1—source data 1. Excel sheet containing raw data from behavior tracking depicted in Figure 1—figure supplement 1E, F and I.
Figure 1—figure supplement 1—source data 2. Excel sheet containing statistics data from behavior tracking depicted in Figure 1—figure supplement 1E, F and I.
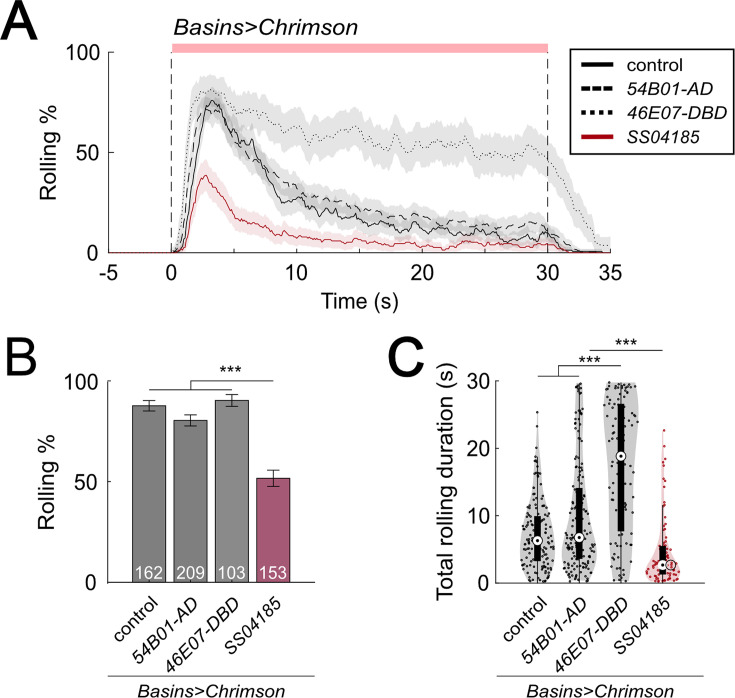
Figure 1—figure supplement 2. Activation of SS04185 inhibits rolling.

Figure 1—figure supplement 2.

(A) Time series of rolling probabilities of larvae during co-activation of SS04185 and Basins (red) and activation of Basins alone (black). Shaded areas represent 95% confidential intervals for rolling probabilities. The red bar and vertical dashed lines denote the optogenetic stimulation window. Genotypes: (1) 20xUAS-IVS-CsChrimson::mVenus/+;; R72F11-Gal4/+ (control), (2) 20xUAS-IVS-CsChrimson::mVenus/+; R54B01-Gal4.AD/+; R72F11-Gal4/+ (54B01-AD), (3) 20xUAS-IVS-CsChrimson::mVenus/+;; R72F11-Gal4/R46E07-Gal4.DBD (46E07-DBD), and (4) 20xUAS-IVS-CsChrimson::mVenus/+; R54B01-Gal4.AD/+; R46E07-Gal4.DBD/ R72F11-Gal4 (SS04185). Genotypes in (B, C) are the same as mentioned here. n = 162, 209, 103, 153. (B) Rolling probabilities of larvae plotted in (A) in the first 5 s of stimulation. Error bars represent the 95% confidence interval. n = 162, 209, 103, 153 from left to right. Statistics: Chi-square test, χ2 = 6.66, p > 0.05 for the left three groups and χ2 = 72.52, p < 0.001 for the comparison between the left three groups and the SS04185 group. (C) A violin plot of total time spent rolling for each individual larva during stimulation. Statistics: Kruskal–Wallis test: H = 105.99, p < 0.001; Bonferroni-corrected Mann–Whitney U test, p > 0.05 for the comparison between control and 54B01-AD; p < 0.001 for all other pairwise comparisons, n = 151, 172, 100, 86. ***p < 0.001.
Figure 1—figure supplement 2—source data 1. Excel sheet containing statistic data from behavior tracking depicted in Figure 1—figure supplement 2C.
Figure 1—figure supplement 2—source data 2. Excel sheet containing raw data from behavior tracking depicted in Figure 1—figure supplement 2B and C.