. 2024 Aug 28;13:RP93978. doi: 10.7554/eLife.93978

Figure 2. SS04185-DN, but not SS04185-MB, inhibits rolling when co-activated with Basins.

(A) Morphology of SS04185 neurons. GFP, gray (left), green (right); nc82, magenta. Anterior, up; dorsal view; scale bar, 100 µm. Genotype: 10xUAS-IVS-myr::GFP/+; R54B01-Gal4.AD/+; R46E07-Gal4.DBD/+. (B) Kenyon cells are less labeled in SS04185 with MB>Killer Zipper. CsChrimson::mVenus expression in Kenyon cells of SS04185 in Control and SS04185 with Killer Zipper in mushroom body (MB). mVenus, gray (left), green (right); nc82, magenta. Anterior, up; dorsal view; scale bar, 20 µm. Genotype: 20xUAS-IVS-CsChrimson::mVenus/+; R54B01-Gal4.AD/+; R46E07-Gal4.DBD/+ (control); 20xUAS-IVS-CsChrimson::mVenus/+; R13F02-LexA,LexAop-KZip+/R54B01-Gal4.AD; R72F11-Gal4/R46E07-Gal4.DBD (MB>KZip+). (C) Rolling probabilities of larvae with activation of SS04185 reduce the expression of CsChrimson in MB neurons. Error bars, 95% confidence interval. n = 78, 55, 100 from left to right. Statistics: Chi-square test, χ2 = 2.32, p > 0.05 for the two groups with SS04185 expression; χ2 = 37.50, p < 0.001 for the comparison between the two groups on the left; χ2 = 70.45, p < 0.001 for the comparison between the groups with MB>KZip + expression which reduce expression of CsChrimson in MB. Genotypes: 20xUAS-IVS-CsChrimson::mVenus/+; R13F02-LexA,LexAop-KZip+/+; R72F11-Gal4/+ (black); 20xUAS-IVS-CsChrimson::mVenusR54B01-Gal4.AD/+; R46E07-Gal4.DBD/R72F11-Gal4 (orange); 20xUAS-IVS-CsChrimson::mVenus/+; R13F02-LexA,LexAop-KZip+/R54B01-Gal4.AD; R72F11-Gal4/R46E07-Gal4.DBD (red). Genotypes in (D–E) are the same as mentioned here. (D) Cumulative plot of rolling duration. Statistics: Kruskal–Wallis test: H = 8.28, p = 0.016; Bonferroni-corrected Mann–Whitney U test, p > 0.05 for all pairwise post hoc tests, n = 103, 20, 27 from left to right. (E) A violin plot of start of first crawling bout for each larva during stimulation. Statistics: Kruskal–Wallis test: H = 15.02, p < 0.001; Bonferroni-corrected Mann–Whitney U test, p > 0.05 for the two groups with SS04185 expression; p < 0.001 for the comparison between the group without SS04185 expression and the groups with full SS04185 expression, n = 65, 20, 7 from left to right. (F) The probabilities of larval rolling during first 5 s of stimulation. Error bars, 95% confidence interval. n = 101, 126. Statistics: Chi-square test, χ2 = 4.27, p = 0.039. Genotype: 13xLexAop2-IVS-CsChrimson::tdTomato/w+, hs-FLP; R54B01-Gal4.AD/72F11-LexA; 20XUAS-(FRT.stop)-CsChrimson::mVenus/R46E07-Gal4.DBD. Genotypes in (G, H) are the same as mentioned here. (G) Cumulative plot of rolling duration. Statistics: Mann–Whitney U test, p < 0.001, n = 350, 473. (H) A violin plot of start of first crawling bout for each larva during stimulation. Statistics: Mann–Whitney U test, p < 0.001, n = 97, 120. ***p < 0.001.

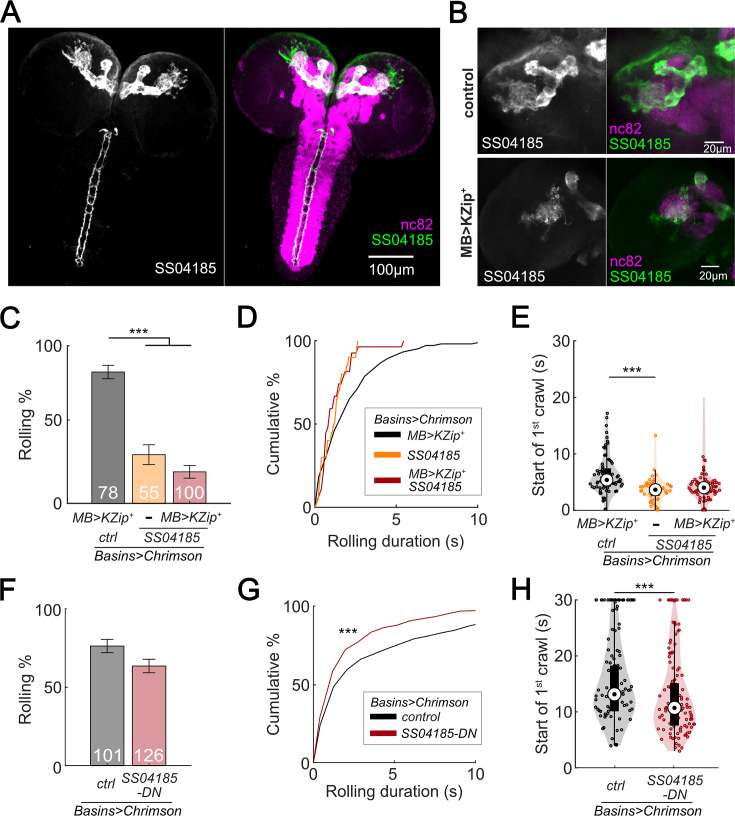
Figure 2—source data 1. Excel sheet containing raw data from behavior tracking depicted in Figure 2D, E, G and H.
Figure 2—source data 2. Excel sheet containing statistic data from behavior tracking depicted in Figure 2C-H.

Figure 2.

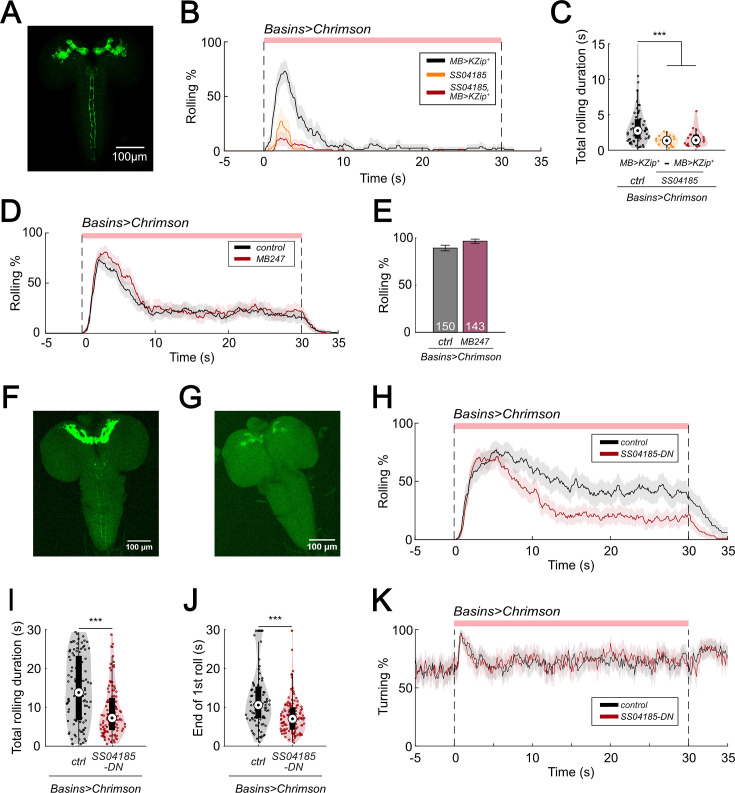
Figure 2—figure supplement 1. SS04185-DN inhibits rolling.

Figure 2—figure supplement 1.

(A) Morphology of SS04185 neurons with split Gal4 inhibition in mushroom body (MB). GFP, green. Anterior, up; dorsal view; scale bar, 100 µm. Genotype: 20xUAS-IVS-CsChrimson::mVenus/+; R13F02-LexA,LexAop-KZip+/R54B01-Gal4.AD; R72F11-Gal4/R46E07-Gal4.DBD. (B) Time series of rolling probabilities of larvae with split Gal4 inhibition in MB (black), SS04185 activation (orange), and both SS04185 activation and split Gal4 inhibition in MB (red). Shaded areas show 95% confidential intervals of rolling probabilities. The red bar and dashed lines display the window of optogenetic stimulation. Genotypes: 20xUAS-IVS-CsChrimson::mVenus/+; R13F02-LexA,LexAop-KZip+/+; R72F11-Gal4/+ (black); 20xUAS-IVS-CsChrimson::mVenus/+; R54B01-Gal4.AD/+; R46E07-Gal4.DBD/R72F11-Gal4 (orange); 20xUAS-IVS-CsChrimson::mVenus/+; R13F02-LexA,LexAop-KZip+/R54B01-Gal4.AD; R72F11-Gal4/R46E07-Gal4.DBD (red). Genotypes in (C) are the same as mentioned here. (C) A violin plot of total time spent rolling for each individual larva during stimulation. Statistics: Kruskal–Wallis test: H = 21.05, p < 0.001; Bonferroni-corrected Mann–Whitney U test, p > 0.05 for the two groups with SS04185 expression; p < 0.001 for the comparison between the group without SS04185 expression and the two groups with SS04185 expression, n = 66, 17, 21 from left to right. (D) Time series of rolling probabilities of larvae with Basin activation (black), or Basin and MB co-activation (red). The red bar and dashed lines display the window of optogenetic stimulation eliciting larval escape responses. Shaded areas show 95% confidential intervals of rolling probabilities. n = 150, 143. Genotype: 20xUAS-IVS-CsChrimson::mVenus/+; +; R72F11-Gal4/+ (control); 20xUAS-IVS-CsChrimson::mVenus/+;+; MB247-Gal4/R72F11-Gal4 (MB247). Genotypes in (E) are the same as mentioned here. (E) Binned larval rolling probabilities during the first 5 s of stimulation in (D). Error bars, 95% confidence interval. n = 150, 143. Statistics: Chi-square test, χ2 = 3.80, p > 0.05. (F) and (G) show immunostaining of SS04185-expressing neurons. SS04185, green. Anterior, up; dorsal view; scale bar, 100 µm. Genotype: w+, hs(KDRT.stop)FLP/13xLexAop2-IVS-CsChrimson::tdTomato; R54B01-Gal4.AD/72F11-LexA; 20xUAS-FRT(stop)-CsChrimson::mVenus/R46E07-Gal4.DB. Genotypes in (H–K) are the same as mentioned here. (F) has both SS04185-DN and SS04185-MB expression only, and (G) has SS04185-MB expression. (H) Time series of rolling probabilities of larvae with SS04185-MB activation (black), or SS04185-MB and SS04185-DN co-activation (red). The red bar and dashed lines display the window of optogenetic stimulation eliciting larval escape responses. Shaded areas show 95% confidential intervals of rolling probabilities. (I) A violin plot of total time spent rolling for each individual larva during stimulation. Statistics: Mann–Whitney U test, p < 0.001, n = 99, 124. (J) A violin plot of end of first rolling bout for each larva during stimulation. Statistics: Mann–Whitney U test, p < 0.001, n = 99, 124. (K) Time series of turning probabilities of larvae with SS04185-MB activation (black), or SS04185-MB and SS04185-DN co-activation (red). The red bar and dashed lines display the window of optogenetic stimulation eliciting larval escape responses. Shaded areas show 95% confidential intervals of turning probabilities. ***p < 0.001.
Figure 2—figure supplement 1—source data 1. Excel sheet containing raw data from behavior tracking depicted in Figure 2—figure supplement 1C, I and J.
Figure 2—figure supplement 1—source data 2. Excel sheet containing statistics data from behavior tracking depicted in Figure 2—figure supplement 1C, E, I and J.