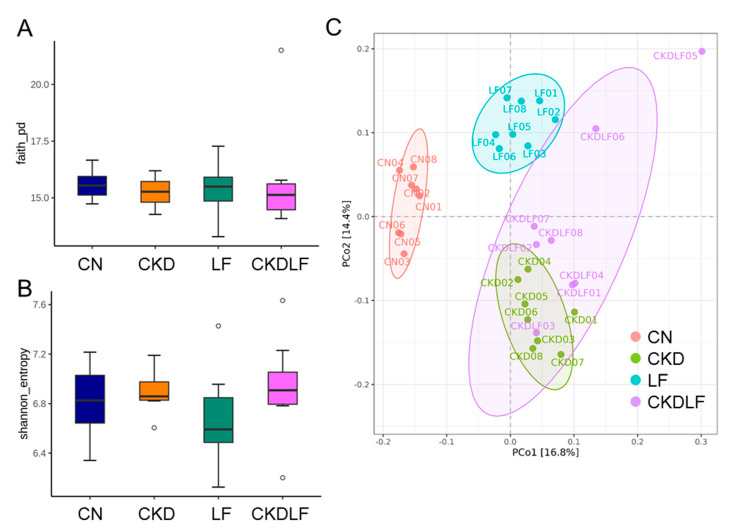
Figure 3.
The evaluation of gut microbial biodiversity in offspring born to dams fed an adenine (CKD) or lactoferrin (LF) diet. (A) Faith’s phylogenic diversity (pd), (B) Shannon index, and (C) principal coordinate analysis (PCoA). Outliers are denoted by dots. Each color corresponds to a different group, with each data point representing one sample.

