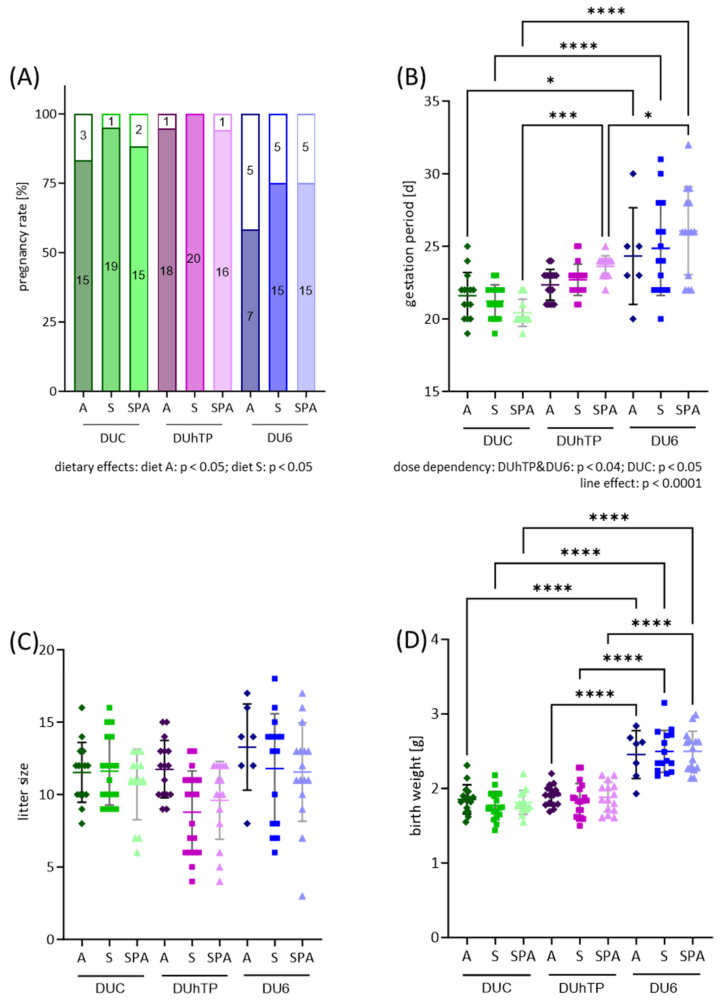
Figure 2.
Effects of genetic background (line) and diet on reproductive performance in female mice. Successful mating was assumed by the presence of a vaginal plug and dated as DOP1 (first day of pregnancy). (A) Pregnancy was determined by the delivery of offspring within 35 days. The pregnancy rate is shown as a percentage bar chart, with integrated numbers of successful and unsuccessful pregnancies. (B) Duration of gestation in female DUC (n ≥ 14), DUhTP (n ≥ 16), and DU6 (n ≥ 6) mice from DOP 1 to birth. Gestation is shown in days as a scatter dot plot, each dot representing one pregnant female mouse. (C) The average litter size of DUC (n ≥ 13), DUhTP (n ≥ 15), and DU6 (n ≥ 7) mice are shown as a scatter dot plot, each dot representing the size of an individual litter. (D) Average offspring birth weights are shown in a scatter dot plot; each dot represents the average body weight of an animal per litter. Colors indicate mouse strain: green—DUC, purple—DUhTP, blue—DU6. The shade of color indicates the chow group: dark—diet A, medium—diet S, and light—diet SPA. Statistical analysis for (A) pregnancy rate was performed using a two-tailed Chi-Square test and a two-way ANOVA for (B–D). Significant differences are indicated as follows: * p < 0.05, *** p < 0.001, **** p < 0.0001. For abbreviations, see Figure 1.

