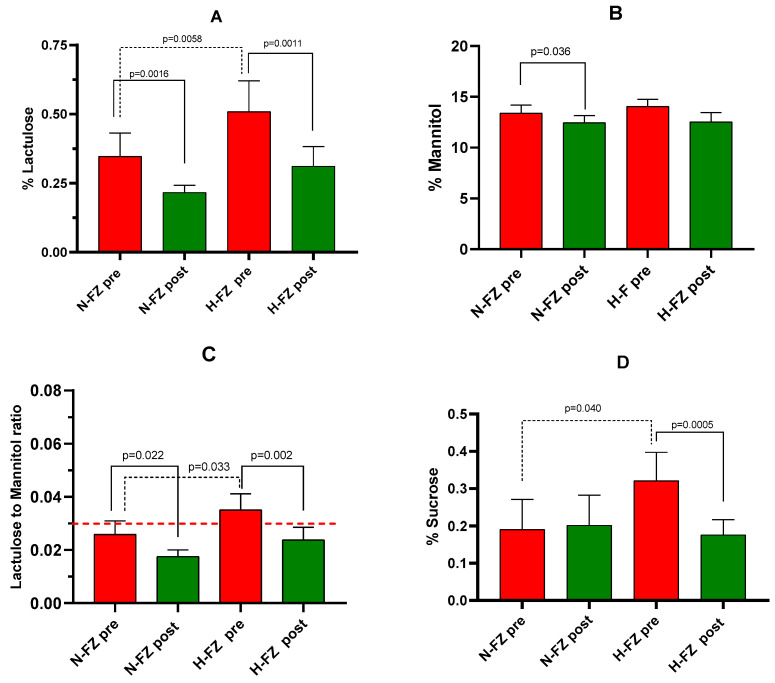
Figure 3.
Gastrointestinal permeability assessed by the sugar absorption test. (A): % lactulose (Lac). (B) % mannitol (Man). (C): Lac/Man ratio. (D): % sucrose. Data are shown for measurements taken before (pre) and after (post) 12 weeks of a diet low in FODMAPs (LFD) in IBS-D patients, categorized by their baseline fecal zonulin levels as either normal (N-FZ) or high (H-FZ). Data are provided as the means ± SEM. The Wilcoxon rank-sum test (solid line) was used for comparison of data before and after diet. The Mann–Whitney test (black dotted line) compared the two subgroups before and after LFD. Significant differences were defined as p-values < 0.05. The red dotted line represents the cutoff value for the Lac/Man ratio (0.030).

