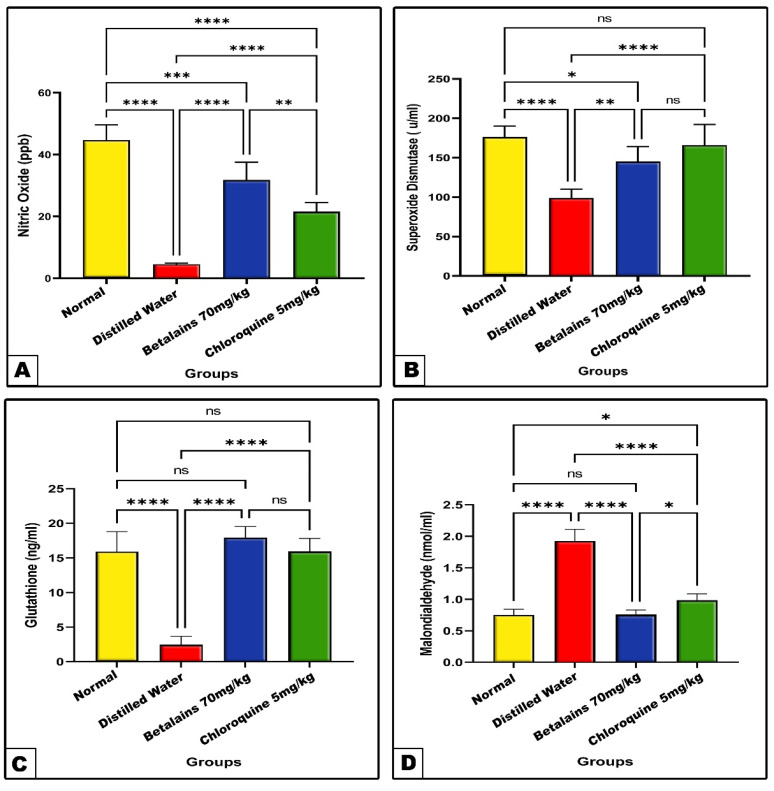
Figure 6.
The mean level of nitric oxide (Panel: (A)), superoxide dismutase (Panel: (B)), glutathione (Panel: (C)) and malondialdehyde (Panel: (D)) of the normal control and the three prophylactic groups of mice. Data are expressed as mean ± SD. (ns) non-significance, significance at * p < 0.05, ** p < 0.01, *** p < 0.001, **** p < 0.0001.

