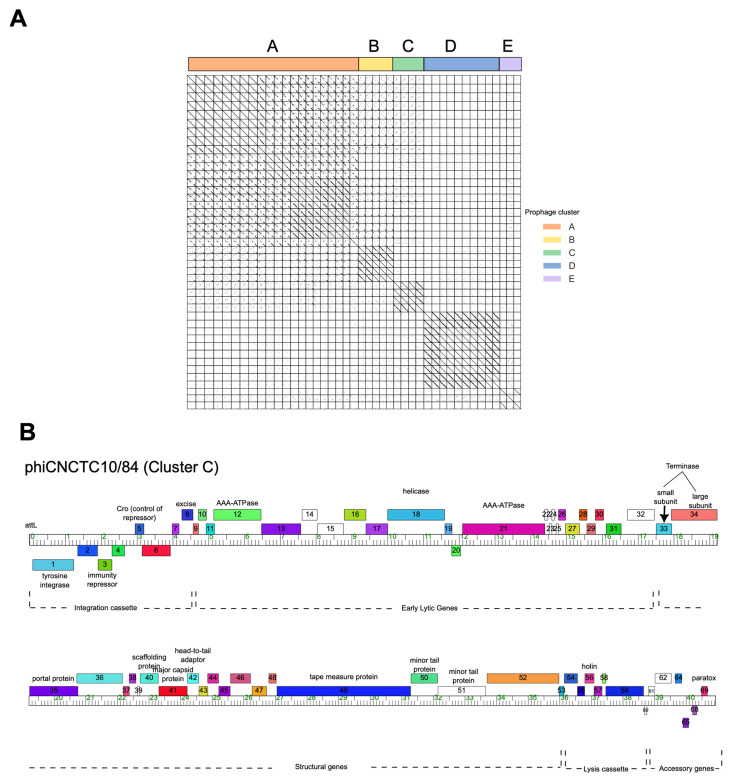
Figure 2.
Prophage diversity. (A) Nucleotide sequence comparison of 43 GBS prophages from whole genome sequences concatenated into a single file and compared with itself using polydot (EMBOSS; word size, 15). Dotplot analysis identified five distinct prophage clusters. (B) Genome map of Callidus showing genome organization with genes represented as boxes above and below the ruler illustrating genes transcribed in the forward and reverse directions, respectively. The genome coordinates are represented by the ruler in units of kilobase pairs. Genes are colored according to assigned ‘phamilies’ with putative gene functions indicated above the genes.

