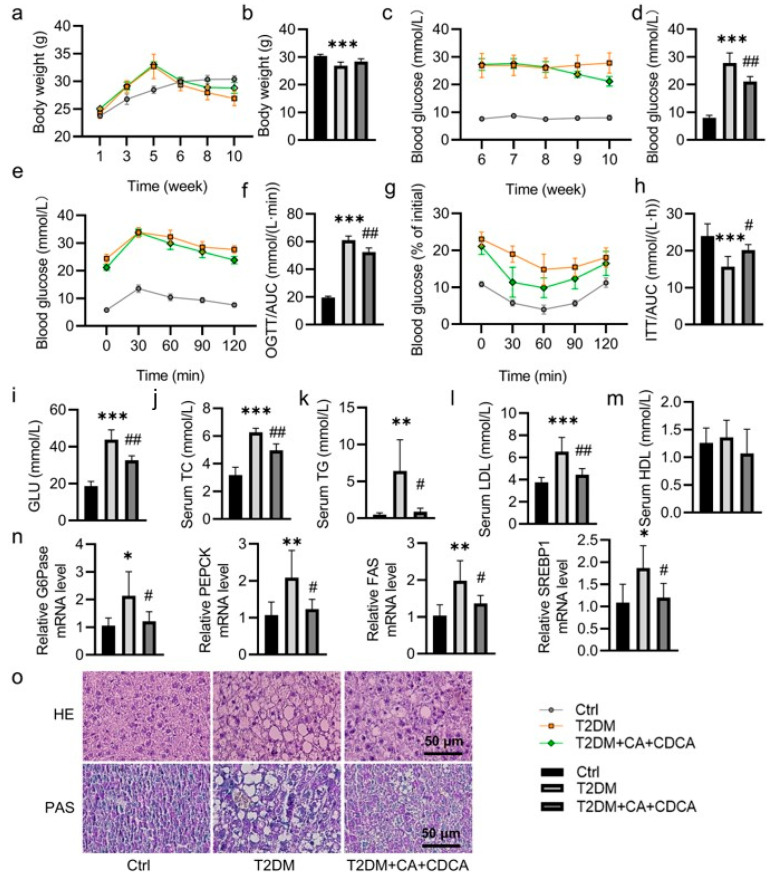
Figure 3.
Effects of CA and CDCA on glucose and lipid metabolism in T2DM mice. Male C57BL/6J mice were fed a high-fat diet for 4 weeks followed by a single intraperitoneal injection of STZ (120 mg/kg). In the sixth week, T2DM mice were given daily intragastric administration of vehicle (PBS) or CA + CDCA (10 mg/kg) for 4 consecutive weeks. (a) Body weight change curve and (b) the weight of mice at the end of the experiment. (c) FBG change curve and (d) FBG of mice at the end of the experiment. (e) Oral glucose tolerance test (OGTT) and (f) AUC of OGTT. (g) Insulin tolerance test (ITT) and (h) AUC of ITT. (i–m) The levels of serum GLU, TC, TG, LDL, and HDL. (n) The relative mRNA levels of G6Pase, PEPCK, FAS, and SREBP1. (o) Representative photographs of the liver with HE and PAS staining. (Scale bar = 50 μm). Data are represented as mean ± SD (n = 6). * p < 0.05, ** p < 0.01, *** p < 0.001 vs. Ctrl; # p < 0.05, ## p < 0.01 vs. T2DM. Ctrl, control; T2DM, type 2 diabetes mellitus; OGTT, oral glucose tolerance test; ITT, insulin tolerance test; GLU, glucose; TC, total cholesterol; TG, triglycerides; LDL, low-density lipoprotein; HDL, high-density lipoprotein; G6Pase, glucose-6-phosphatase; PEPCK, phosphoenolpyruvate carboxykinase; FAS, fatty acid synthase; SREBP1, sterol regulatory element-binding protein 1; HE, hematoxylin-eosin; PAS, Periodic acid–Schiff.

