Fig. 1.

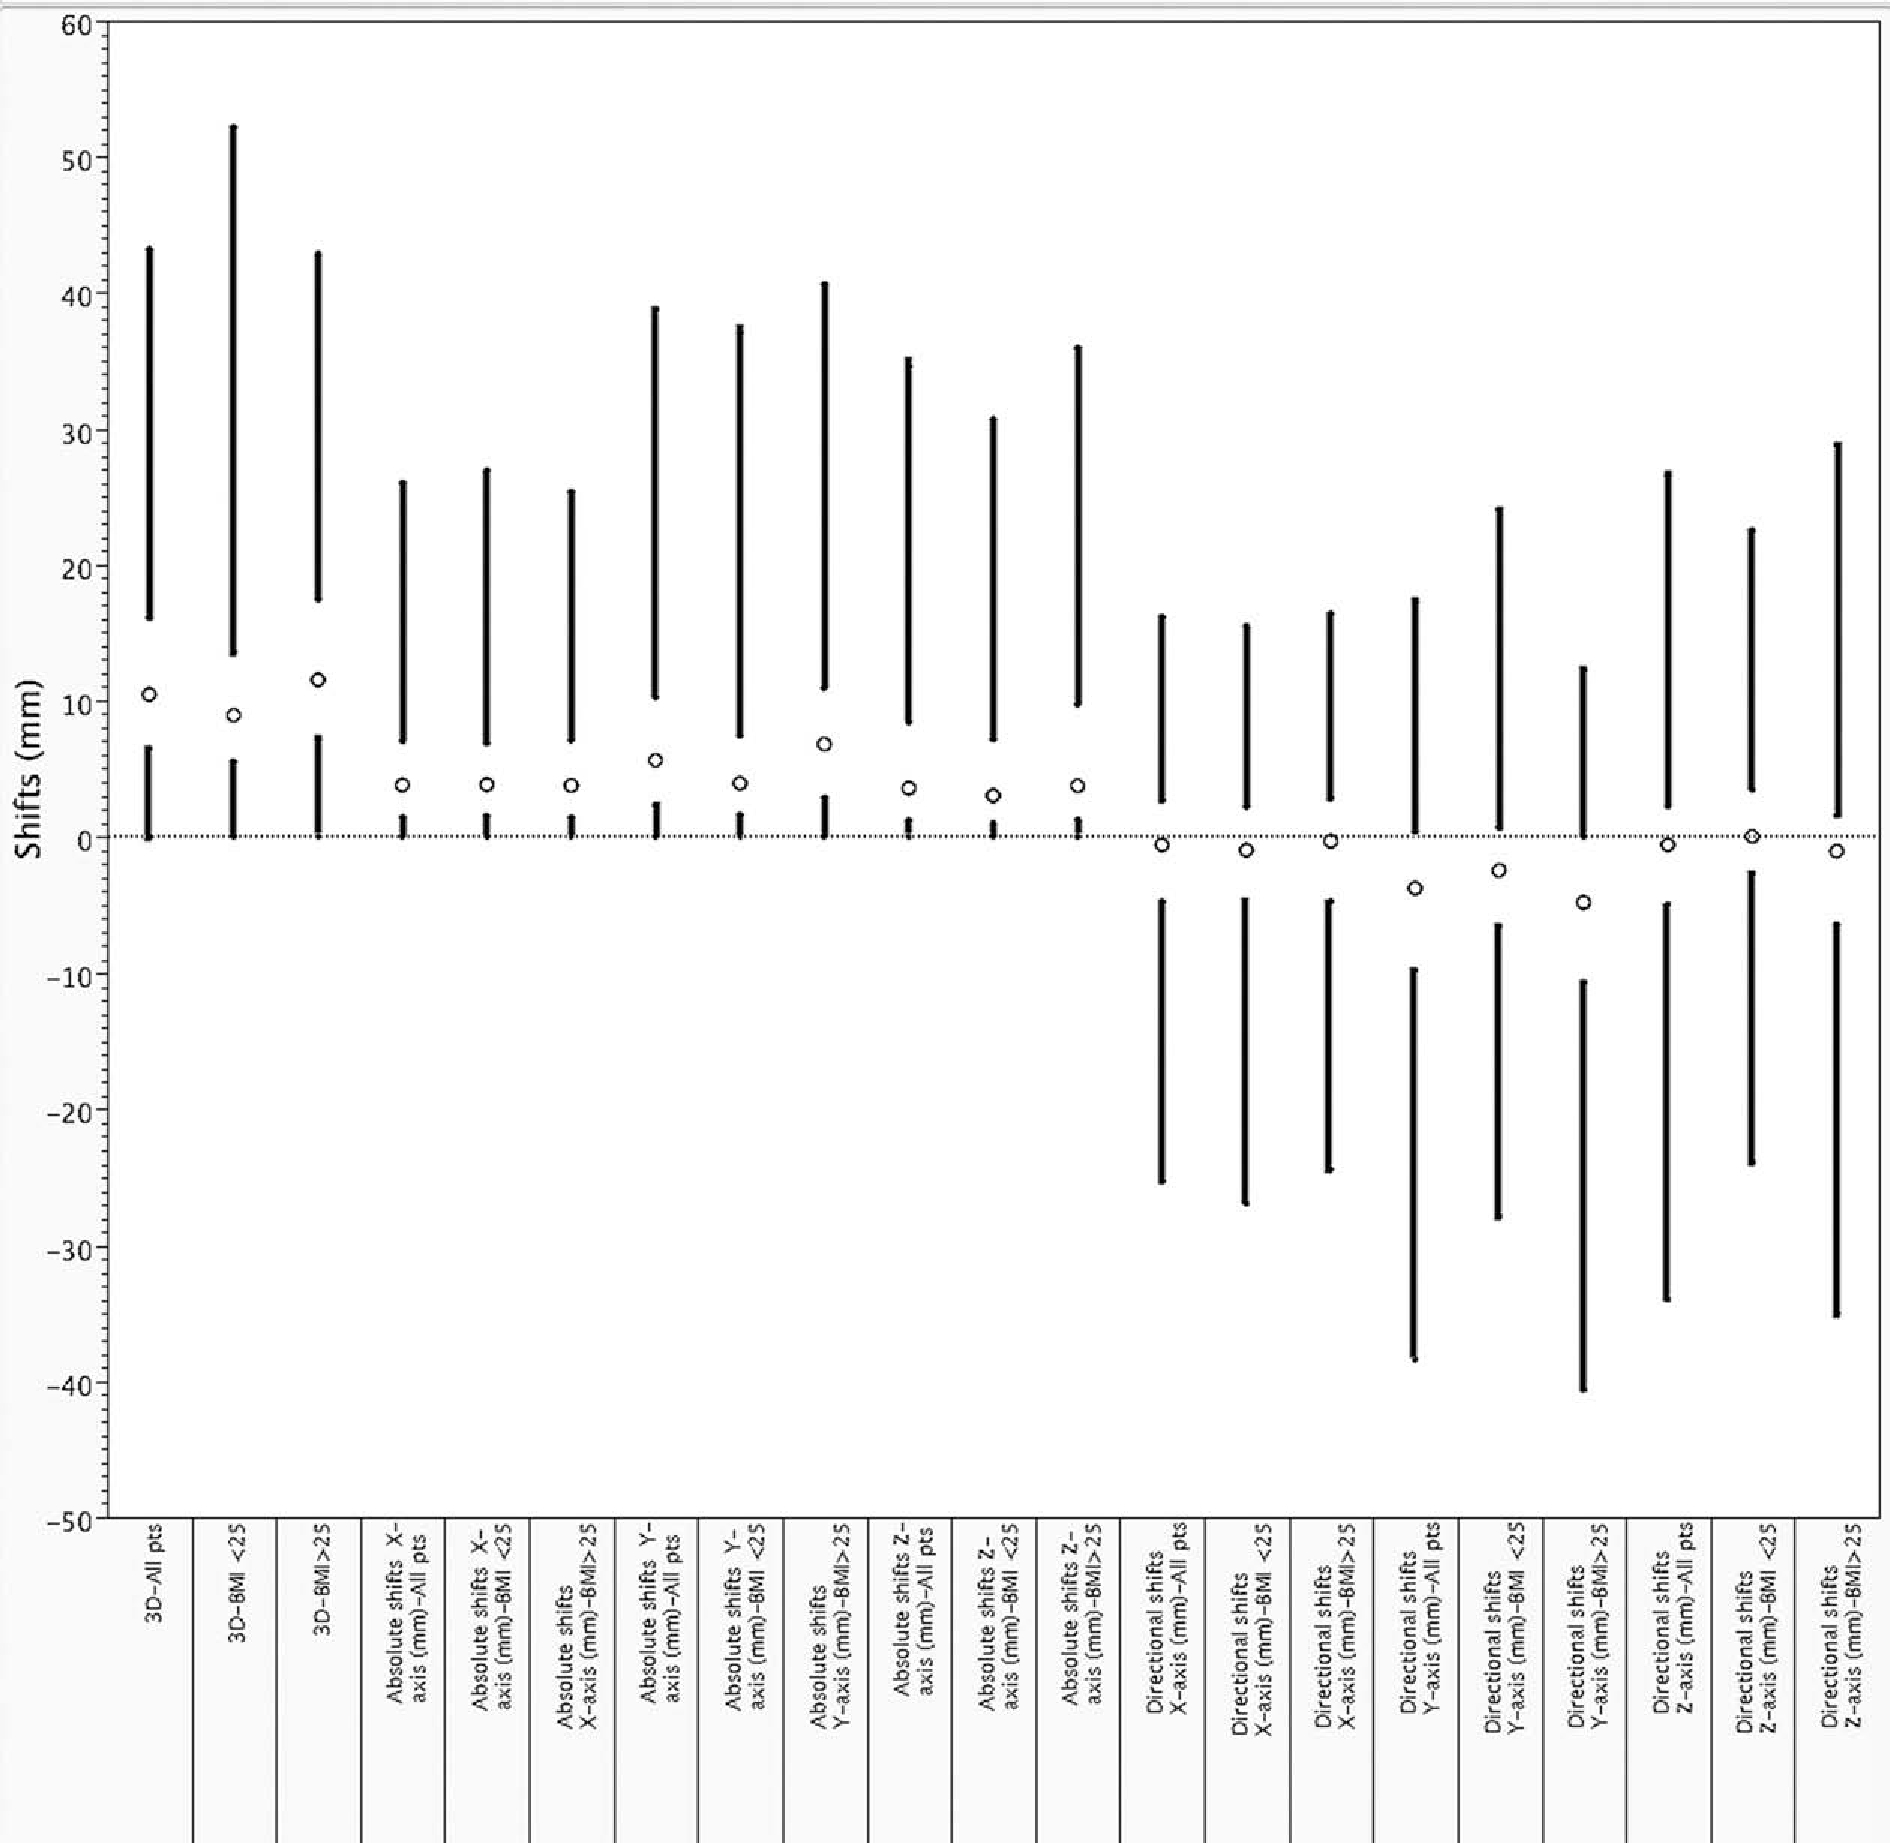
Ultrasound corrective shift distributions by vector/axis by for all patients and by BMI class; mean values are represented by circles, standard deviations by gap between bars, and ranges by black bars.

Ultrasound corrective shift distributions by vector/axis by for all patients and by BMI class; mean values are represented by circles, standard deviations by gap between bars, and ranges by black bars.