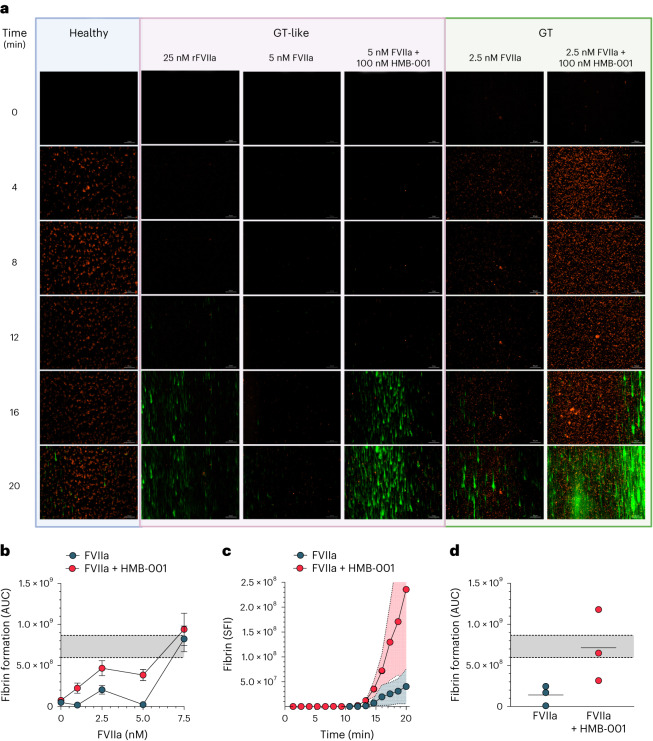
Fig. 8. HMB-001 enhances fibrin formation on adhered GT platelets in flowing blood.
a–d, Recalcified whole blood was perfused over a collagen-coated surface in a microfluidic device at a shear rate of 300 s−1. Platelets were labeled with MitoTracker Orange CMTMRos, and fibrin was detected with an Alexa Fluor 488-conjugated VHH antifibrin antibody. Platelet adhesion and fibrin deposition were monitored in whole blood from healthy controls, whole blood from healthy controls supplemented with d-RGDW (GT-like), and whole blood from PwGT. Platelet adhesion and fibrin deposition were monitored for 20 min at a frame rate of three per minute using a Zeiss Observer Z1 widefield fluorescence microscope with Colibri LEDs at 200-fold magnification. a, Representative time-lapse of platelet adhesion (orange) and fibrin deposition (green) in blood from healthy controls; GT-like whole blood with 25 nM rFVIIa, 5 nM FVIIa, and 0 or 100 nM HMB-001; and whole blood from a PwGT supplemented with 2.5 nM FVIIa and 0 or 100 nM HMB-001. b, Fibrin deposition was quantified using ZEN 2 (blue edition) software. Data are expressed as the area under the curve (AUC) of fibrin deposition on platelets adhered to collagen in GT-like whole blood supplemented with 0–7.5 nM FVIIa and 0 or 100 nM HMB-001 (n = 3–7 for each concentration). Gray area between dotted lines represents the mean area under the curve ± s.d. of fibrin deposition in GT-like whole blood supplemented with 25 nM rFVIIa (n = 7). c, Fibrin deposition on platelets adhered to collagen after the perfusion of whole blood from PwGT (n = 3) supplemented with 2.5 nM FVIIa and 0 or 100 nM HMB-001. Data are expressed as the mean sum of fluorescence intensity on each frame (SFI) as a function of time. Shaded areas indicate s.d. d, Area under the curve of fibrin deposition in whole blood from PwGT (n = 3) supplemented with 0 or 100 nM HMB-001. Gray area between dotted lines represents the mean area under the curve ± s.d. of fibrin deposition in GT-like whole blood supplemented with 25 nM rFVIIa (n = 7).

