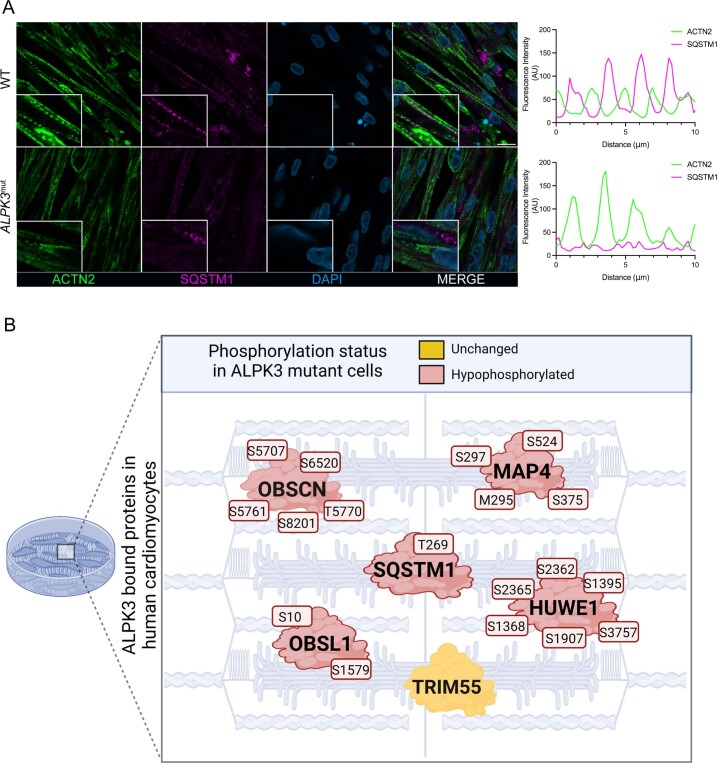
Extended Data Fig. 10. SQSTM1 localization in WT and ALPK3mut hPSC-derived skeletal muscle cells.
a. Immunofluorescent micrograph of WT and ALPK3mut hPSC-skeletal muscle stained for alpha actinin (green), SQSTM1 (magenta), and DAPI (blue). Scale bar = 15 µm. Line profile demonstrating alpha actinin and SQSTM1 organization. b. Graphical representation of select proteins bound to ALPK3 which also showed reduced phosphopeptide abundance in ALPK3mut hPSC-CMs. The affected phosphorylation sites are also highlighted. Created with BioRender.com.

