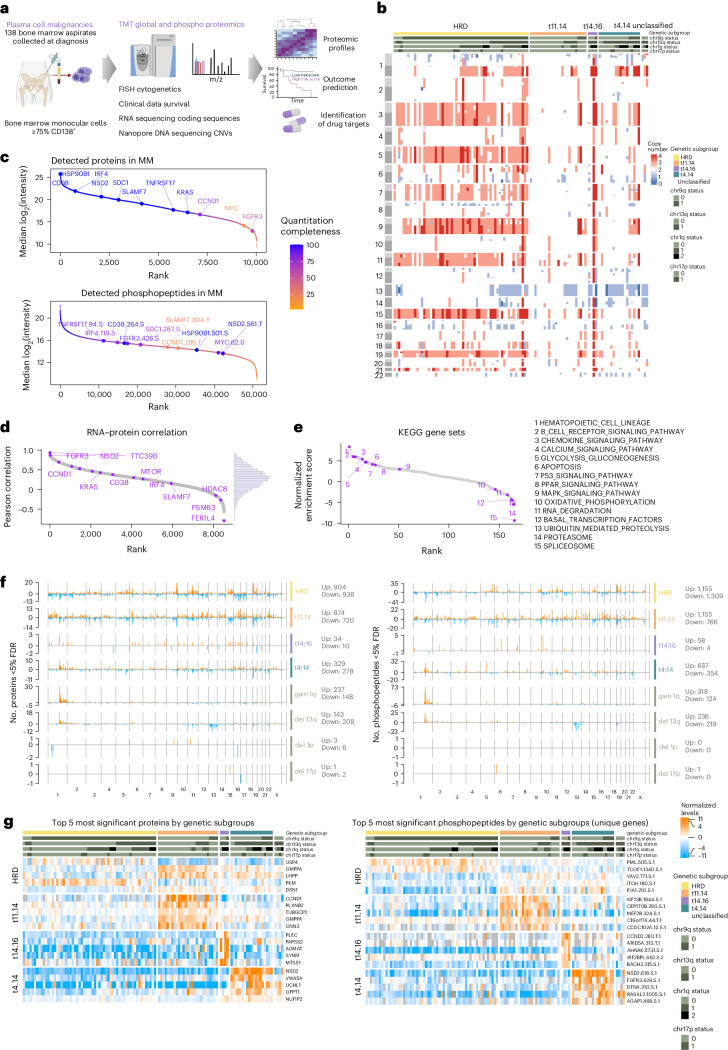
Fig. 1. Proteogenomic landscape of newly diagnosed MM.
a, Overview of the proteogenomic study. b, A heat map of CNVs detected by nanopore sequencing in 109 cases of NDMM sorted by primary genetic subgroup: HRD, t(11;14), t(4;14) and t(14;16) translocations. Cytogenetic alterations, including deletions, amplifications and translocations were detected by FISH. c, Proteins and phosphopeptides detected by TMT-based mass spectrometry ranked by median intensity. d, Ranked gene symbol-wise Pearson correlation of mRNA–protein levels across MM samples (n = 8,511 RNA–protein pairs with at least ten valid values in both datasets). e, ssGSEA of the mRNA–protein correlations for KEGG pathways (n = 165 ranked pathways). Gene sets were ranked by their normalized enrichment score and informative pathways are annotated with purple circles. f, Differentially regulated proteins (left) and phosphopeptides (right) in each cytogenetic subgroup were determined with a two-sided, moderated two-sample t-test comparing subsets of samples against all other samples. The number of significant hits (FDR <0.05) in each group is plotted across genomic location. g, Heat maps displaying the five most significant proteins (left) and phosphopeptides (right) in each genetic subgroup across MM samples. For phosphopeptides mapping to the same protein, only the most significant entry is displayed. Phosphopeptides are annotated with gene name, position, amino acid and number of phosphorylations present.

