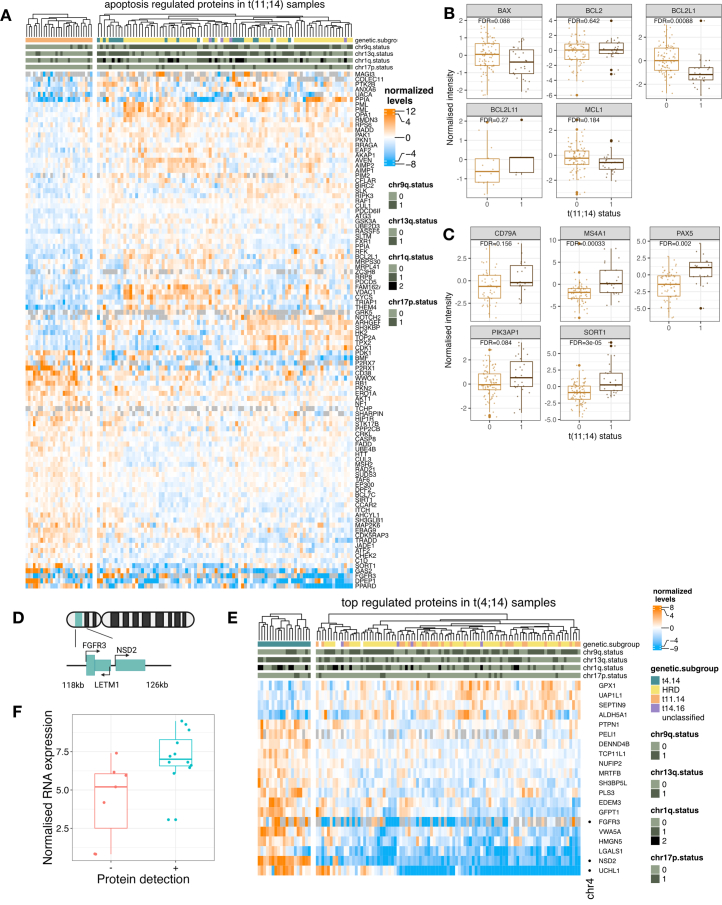
Extended Data Fig. 3. Protein level changes in multiple myeloma patients with translocations t(11;14) and t(4;14).
a: Significantly regulated proteins in t(11;14) (FDR < 0.05) with the GO term annotation apoptosis. b: Levels of proteins involved in venetoclax response in patients with (n = 27) and without (n = 87) t(11;14). FDR is indicated. Boxplot shows median (middle line), 25th and 75th percentiles, whiskers extend to minimum and maximum excluding outliers (values greater than 1.5 times the interquartile range). c: Protein levels of selected B cell markers and genes in CD2 gene set in patients with (n = 27) and without (n = 87) t(11;14). FDR is indicated. Boxplot shows median (middle line), 25th and 75th percentiles, whiskers extend to minimum and maximum excluding outliers (values greater than 1.5 times the interquartile range). d: Schematic representation of the chromosomal locus on 4p16 affected by t(4;14). e: Levels of the most regulated proteins in t(4;14) samples (top 20 by FDR). Row annotation: dots indicate proteins located on chromosome 4. f: Normalized FGFR3 RNA levels in t(4;14) patients with (n = 13) or without (n = 7) FGFR3 protein detection. FDR is indicated. Boxplot shows median (middle line), 25th and 75th percentiles, whiskers extend to minimum and maximum excluding outliers (values greater than 1.5 times the interquartile range).

