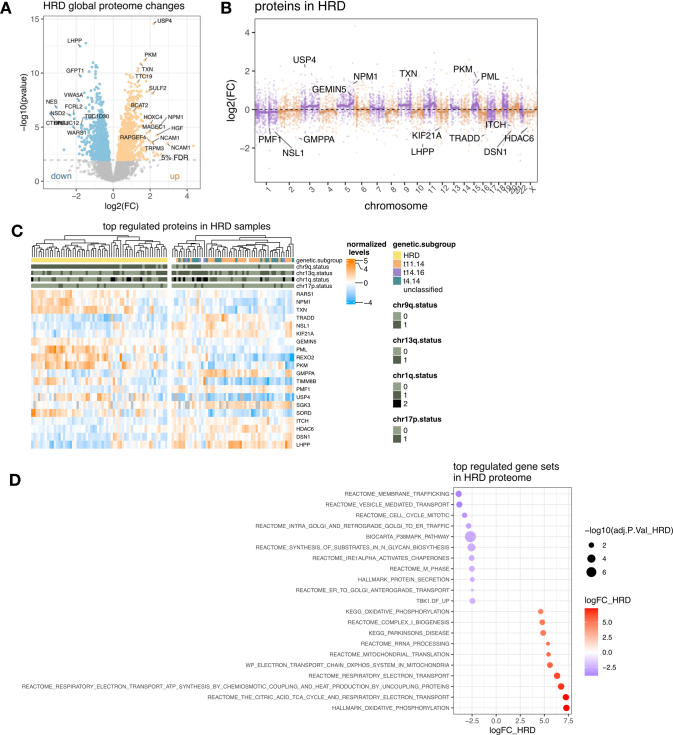
Extended Data Fig. 4. Proteins deregulated in hyperdiploid myeloma.
a: Global protein levels in HRD samples without translocation were compared against all other samples with a 2-sided, moderated 2-sample t-test. The log2 of fold change of each protein is plotted against its p-value. P-values were adjusted with the Benjamini-Hochberg method and the significance threshold of 0.05 FDR is indicated. b: Log2 fold changes of proteins in HRD samples mapped to the chromosomal location. Line indicates smoothed conditional mean. The 15 most significantly regulated proteins in HRD samples are indicated by gene name. c: Protein levels (normalized TMT ratios) of the most regulated proteins in HRD samples (top 20 by FDR). d: Normalized TMT ratios were used as input for an ssGSEA with the gene sets C2.all.v7.0.symbols.gmt, c6.all.v7.0.symbols.gmt and h.all.v7.0.symbols.gmt. Normalized enrichment scores in HRD samples were compared against HRD samples with a 2-sided, moderated 2-sample t-test. The most 10 most up and down regulated significant gene sets (< 0.05 FDR) are displayed.

