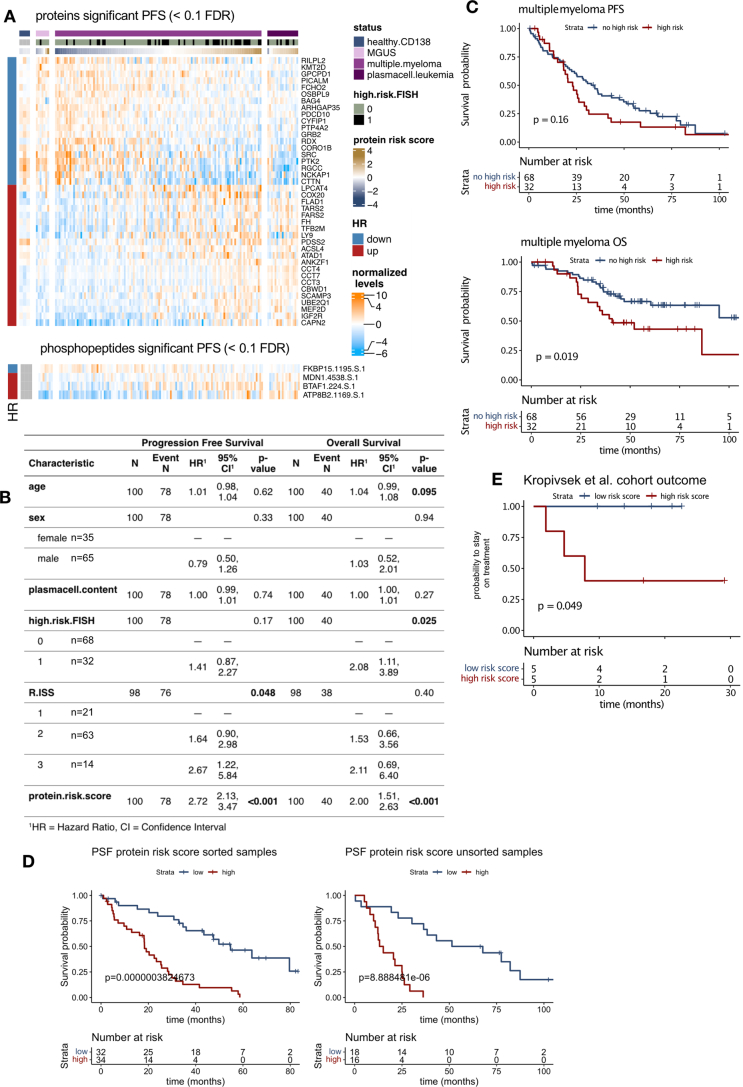
Extended Data Fig. 8. Proteins and phosphopeptides associated with outcome.
a: Fully quantified proteins and phosphopeptides were investigated for their correlation with progression-free survival with a univariate Cox regression analysis as a continuous variable. The resulting p-values were subjected to multiple testing control with Benjamini-Hochberg. Normalized expression levels of proteins and phosphopeptides passing the 0.1 FDR cutoff are plotted as a heatmap. Row annotation indicates hazard ratios > 1 (up) or < 1 (down). b: Table showing the impact of clinical parameters and protein risk score on progression-free survival (PFS) and overall survival (OS). P-values were calculated with univariate Cox regression analysis. c: Kaplan-Maier plots showing PFS and OS curves of patients with (blue) and without (red) at least one high-risk FISH marker (del(17p), t(4;14), +1q21). P-values were calculated with a log-rank test. Patients treated within the DSMM clinical trials that received a lenalidomide-based induction therapy followed by high-dose melphalan/autologous hematopoietic stem cell transplantation and lenalidomide maintenance were included (n = 100) in the survival analysis. d: Kaplan-Meier plots showing progression-free survival (PFS) for patients according to the protein risk signature score in samples with and without CD138 MACS sorting. Survival in the groups is compared by the log rank test. e: Proteomics data was extracted from Kropvisek et al. and protein risk score was calculated for untreated myeloma patients (n = 10). Kaplan-Meier plot shows time to the next treatment or death for myeloma patients stratified by median risk score. Survival in the groups is compared by the log rank test.

