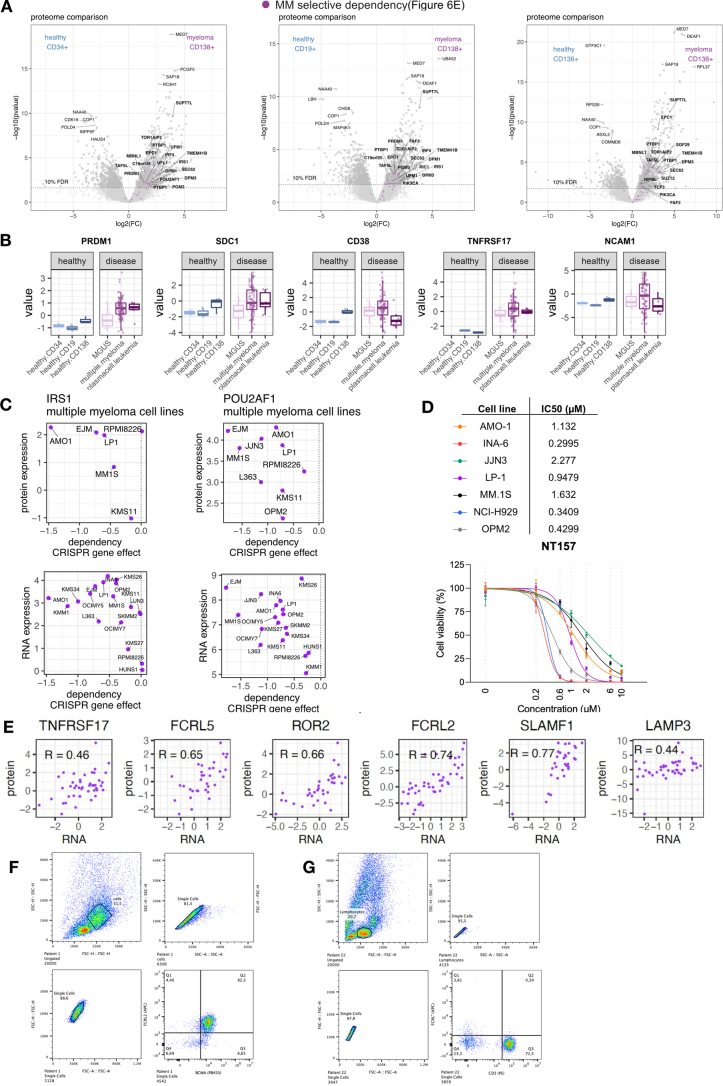
Extended Data Fig. 9. Comparison of multiple myeloma with healthy bone marrow reveals potential therapeutic targets.
a: Global protein levels of multiple myeloma samples (MACS sorted samples only, n = 76) and healthy bone marrow cells sorted for CD138+ (plasma cells, n = 3), CD19+ (B cells, n = 3) and CD34+ (HSC, n = 3) were compared with a 2-sided, moderated 2-sample t-test. The log2 of fold change of each protein is plotted against its p-value. P-values were adjusted with the Benjamini-Hochberg method and the significance threshold of 0.1 FDR is indicated. Data was integrated with the depmap database and potential therapeutic targets (Fig. 6d) are indicated as purple stars. b: Protein levels of selected plasma cell-specific proteins in healthy and disease samples. Healthy CD138: n = 3; healthy CD19: n = 3, healthy CD34: n = 3; MGUS: n = 7; MM: n = 114;. PLC: n = 17. Boxplot shows median (middle line), 25th and 75th percentiles, whiskers extend to minimum and maximum excluding outliers (values greater than 1.5 *IQR). c: Protein (top) or RNA (bottom) expression of IRS1 and POU2AF1 in multiple myeloma cell lines plotted against genetic dependency. Data was extracted from the depmap database and Goncalves et al. d: Cell viability of multiple myeloma cell lines treated for 96 h with the IRS1 inhibitor NT157 in biological triplicates. Concentration is indicated in µM. Data is represented as mean ± standard deviation. e: RNA to protein correlation of selected surface markers in myeloma samples displayed in Fig. 7. f and g: Representative plot showing gating strategy for the FACS analysis in Fig. 7d–f: Multiple myeloma cells, G: non-malignant cells on example of T cells.

