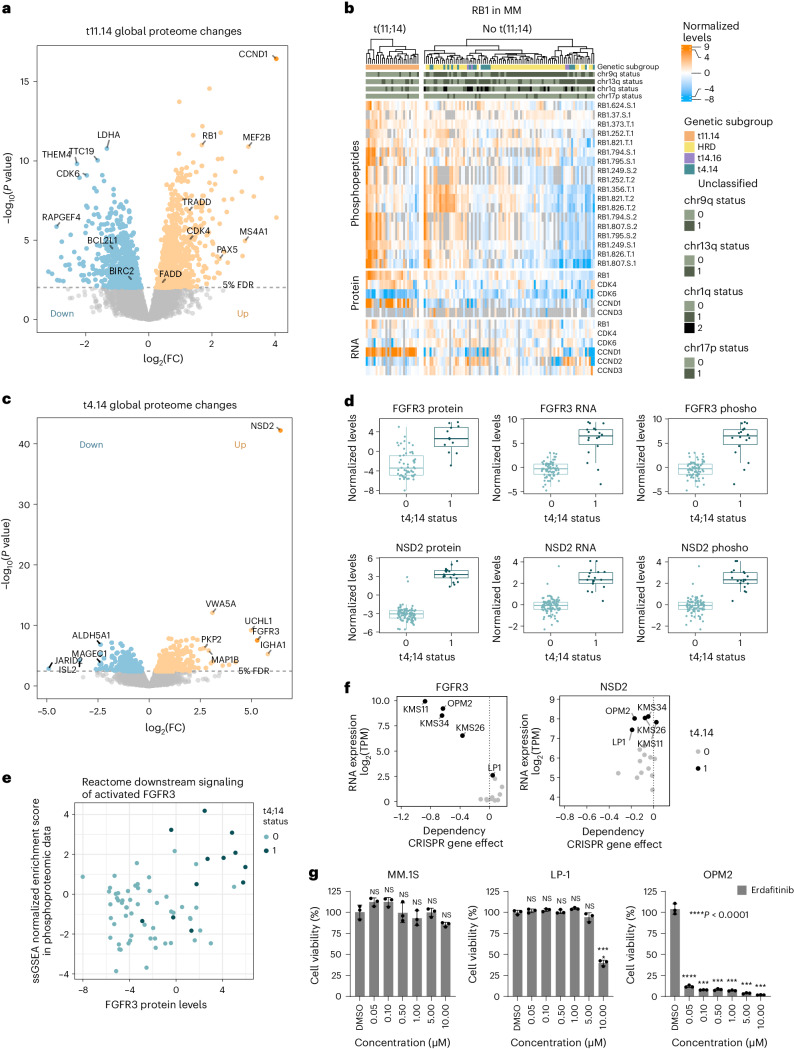
Fig. 2. (Phospho)proteomic profiles of primary translocations t(11;14) and t(4;14).
a, Global protein levels in newly diagnosed MM cases with t(11;14) (n = 27) were compared against cases without t(11;14) (n = 87) with a two-sided, moderated two-sample t-test. The log2 fold change (FC) of each protein is plotted against its P value. P values were adjusted with the Benjamini–Hochberg method and the significance threshold of 0.05 FDR is indicated. b, The heat map displays the normalized expression of RB1, CDK4, CDK6, CCND1, CCND2 and CCND3 on RNA and protein level and RB1 phosphopeptides. Phosphopeptides are annotated with protein name, position, amino acid and number of phosphorylations. c, Global protein levels in cases with t(4;14) (n = 19) were compared against other MM cases (n = 95) with a two-sided, moderated two-sample t-test. The log2FC of each protein is plotted against its P value. P values were adjusted with the Benjamini–Hochberg method and the significance threshold of 0.05 FDR is indicated. d, Protein, phosphoprotein and RNA expression levels of FGFR3 and NSD2 in samples with (n = 19) or without t(4;14) (n = 95). For phosphopeptide data, the peptide with the least missing values was selected for a graphical representation (FGFR3.S.425; NSD2.S.618). FDRs of the comparison between the two groups are indicated. Box plots show median (middle line), 25th and 75th percentiles, whiskers extend to minimum and maximum excluding outliers (values greater than 1.5× interquartile range (IQR)). e, FGFR3 protein levels in MM samples are plotted against the ssGSEA normalized enrichment score of the Reactome gene set ‘Downstream signaling of activated FGFR3 in phosphoproteomic data’. Normalized TMT ratios in each sample were used as input for ssGSEA. f, FGFR3 and NSD2 RNA expression and CRISPR–Cas9 KO screening data in MM cell lines were extracted from the depmap portal (depmap.org). RNA expression is plotted against the CRISPR KO gene effect. g, Cell viability of MM cell lines after treatment with FGFR3 inhibitor erdafitinib for 96 h at indicated concentrations (n = 3, independent replicates). Data are plotted as mean ± s.d. Drug treatments of each cell line were compared to respective DMSO controls with a Dunnett’s test. ****P value < 0.0001. Exact P values listed in the source table.

