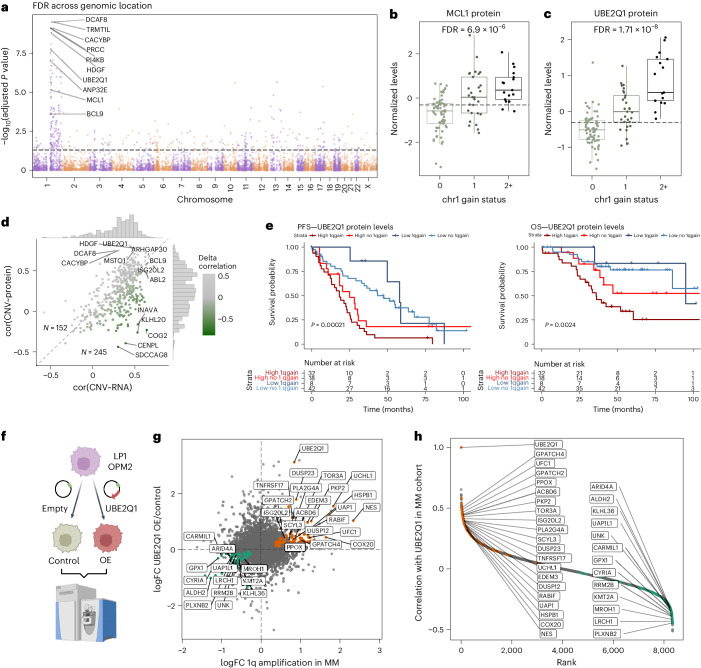
Fig. 3. Identification of UBE2Q1 as a candidate protein for the aggressive phenotype of MM with gain/amp of chromosome 1q.
a, Global protein levels in MM samples with 1q copy number gain (n = 46) were compared against all other samples (n = 68) with a two-sided, moderated two-sample t-test. The −log10(FDR) of each protein is plotted across genomic location. The significance threshold of 0.05 FDR is indicated. b, MCL1 protein levels in patients with MM grouped by 1q gain status. FDR for the comparison 1q gain versus no 1q gain is indicated (0: n = 68; 1: n = 29; 2+: n = 17). Box plots show median (middle line), 25th and 75th percentiles, whiskers extend to minimum and maximum excluding outliers (values greater than 1.5× IQR). c, UBE2Q1 protein levels in patients with MM grouped by 1q gain status. FDR for the comparison 1q gain versus no 1q gain is indicated (0: n = 68; 1: n = 29; 2+: n = 17). Box plot shows median (middle line), 25th and 75th percentiles, whiskers extend to minimum and maximum excluding outliers (values greater than 1.5× IQR). d, Genes located on chromosome 1q with at least ten valid value pairs in all datasets (RNA, DNA and protein) were extracted (n = 397 genes). The Pearson correlation coefficient of copy number determined by nanopore sequencing with RNA expression level (cor(CNV~RNA)) is plotted against the Pearson correlation coefficient of copy number with protein expression level (cor(CNV~protein). e, Kaplan–Meier plots show survival of patients grouped by UBE2Q1 protein levels (median) and 1q gain status. Survival in the different groups is compared by a log rank test. f, UBE2Q1 was overexpressed in LP1 and OPM2 cell lines. Empty vectors were used as a control. Cell lines were analyzed with label-free DIA proteomics (n = 4, biological replicates). g, Correlation of protein FCs in 1q gain myeloma patients (x axis) and UBE2Q1 overexpressing LP1 cells compared with control (y axis). Proteins regulated in LP1 cells (<0.05 FDR) and patients with MM with 1q gain (<0.1 FDR) and correlating with UBE2Q1 protein levels in myeloma cohort (r > 0.3 or r < −0.3) are indicated. h, Correlation analysis of UBE2Q1 with all other protein levels in newly diagnosed MM. Proteins are ranked by their Pearson correlation coefficient. The same proteins as in g are highlighted.

