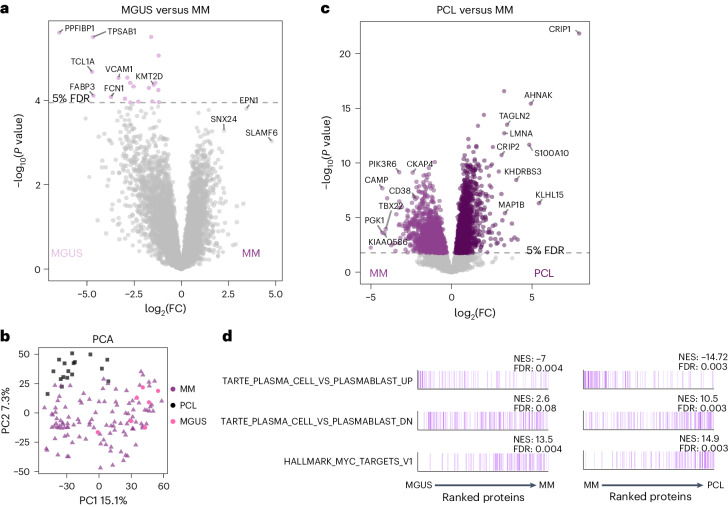
Fig. 4. Proteome profiles of MGUS and PCL.
a, Global protein levels in newly diagnosed MM samples (n = 114) were compared with those in premalignant MGUS samples (n = 7) with a two-sided, moderated two-sample t-test. The log2FC of each protein is plotted against its P value. P values were adjusted with the Benjamini–Hochberg method and the significance threshold of 0.05 FDR is indicated. b, PCA of global proteome data of newly diagnosed MM, MGUS and PCL samples. c, Global protein levels in MM samples (n = 114) were compared against PCL (n = 17) with a two-sided, moderated two-sample t-test. The log2 fold change of each protein is plotted against its P value. P values were adjusted with the Benjamini–Hochberg method and the significance threshold of 0.05 FDR is indicated. d, The mean log2 fold change of proteins in MM versus MGUS or PCL versus MM or samples was used as input for an ssGSEA analysis. The plot shows proteins ordered by their rank; proteins belonging to the respective gene set are marked by color. The normalized enrichment score (NES) and FDR of each gene set are indicated.

