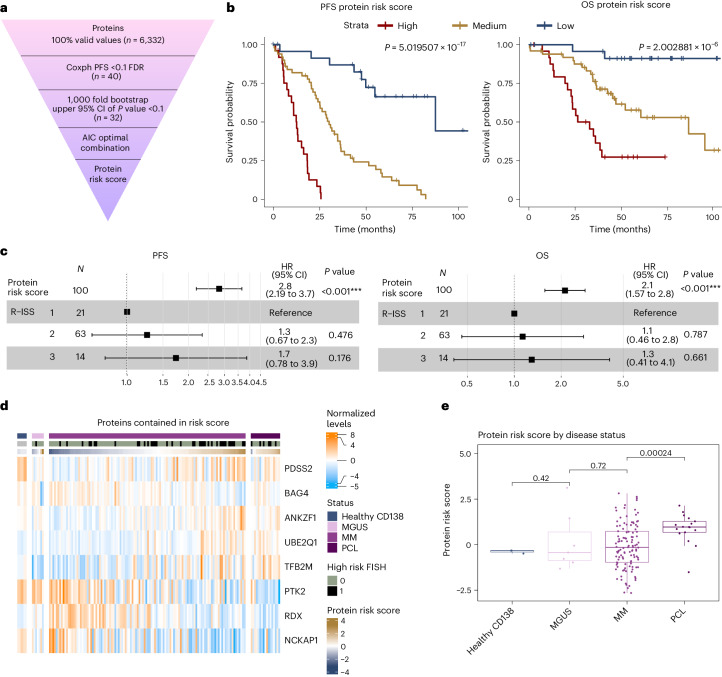
Fig. 5. A proteomic risk score predicts outcome in NDMM.
a, The workflow for the generation of a proteomic risk score in patients with NDMM who received a lenalidomide-based intensive treatment within clinical trials (n = 100). b, Kaplan–Meier plots show PFS and OS for patients according to the protein risk signature score divided by lowest quartile (low, n = 25), second and third quartile (medium, n = 50) and highest quartile (high, n = 25). Survival in the different groups is compared by the log rank test. c, Multivariable Cox regression analysis for PFS and OS including the protein risk score as continuous variable (hazard ratio (HR) per 1 point increase) and R-ISS. Data are represented as hazard ratio with 95% confidence interval (CI). Significance was tested with a Wald test. d, Expression of proteins contained in the protein high-risk score across samples from healthy donors, patients with premalignancy MGUS, MM and PCL. e, Protein risk score values calculated for the proteome data of healthy plasma cells, MGUS, MM and PCL samples. P values from a two-sided Student’s t-test are indicated. Healthy CD138: n = 3; MGUS: n = 7; MM: n = 114; PCL: n = 17. Box plots show median (middle line), 25th and 75th percentiles, whiskers extend to minimum and maximum excluding outliers (values greater than 1.5× IQR).

