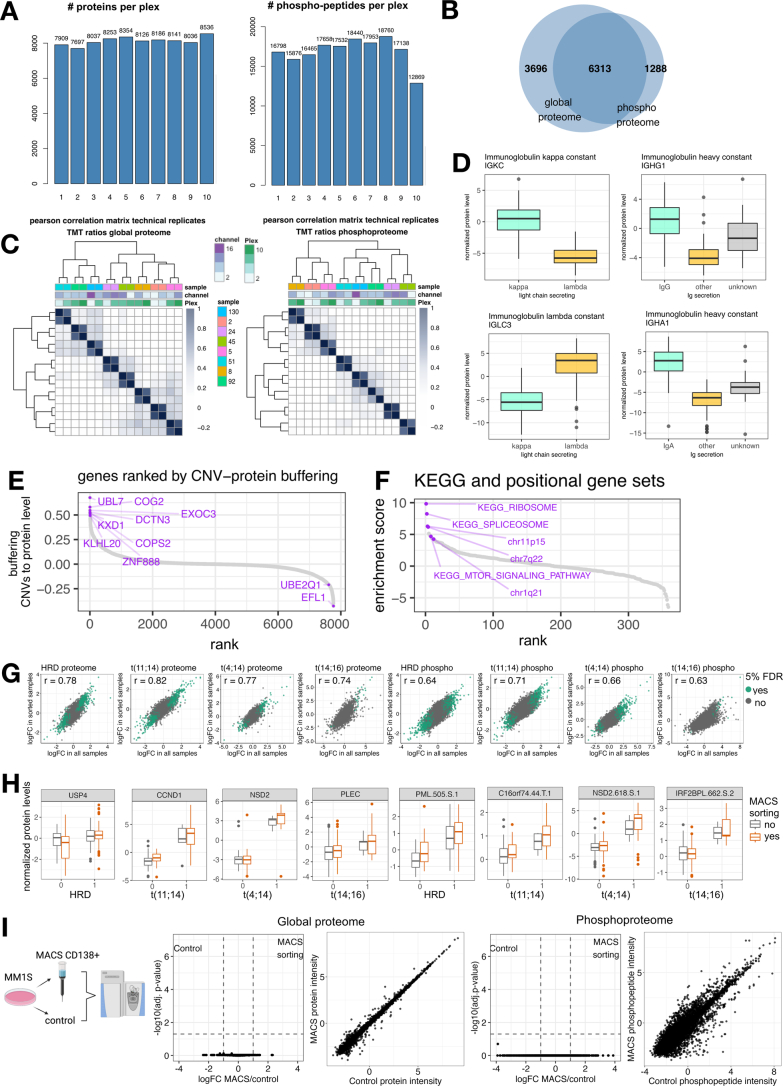
Extended Data Fig. 1. Quality control and influence of cell sorting.
a: Numbers of proteins and phosphopeptides detected in each TMT plex. b: Overlap of detected protein IDs in the proteome and phosphoproteome datasets. c: Correlation matrix showing Pearson correlation of technical replicates (normalized TMT ratios). d: Immunoglobulin constant light chain protein levels. Predominant light chain kappa n = 83, lambda n = 39. Predominant immunoglobulin constant IgG n = 68, IgA n = 32; other n = 24, unknown n = 14. Boxplots show median (middle line), 25th and 75th percentiles, whiskers extend to minimum and maximum excluding outliers (values outside of 1.5 times the interquartile range (IQR)). e: Genes ranked by the buffering score of CNVs from RNA to protein level. The buffering score was calculated with a customized score and for each gene (g) the Pearson correlation of protein to copy number (CN) was subtracted from the Pearson correlation of RNA to CN. The resulting delta was corrected with the average copy number effect diverging from a diploid genotype. Genes are ranked from highest (high buffering of CNVs from RNA to protein level) to lowest score. f: SsGSEA of the protein-CNV buffering score in S1E for KEGG and positional pathways (n = 359 ranked pathways) showing that CNVs of certain pathways are buffered from RNA to protein level. g: Correlation of protein and phosphopeptides changes in each genetic subgroup in all samples (x-axis) and MACS-sorted samples (y-axis) in MM cohort. Regulated proteins (< 0.05 FDR) are indicated in green. h: Levels of top-regulated proteins and phosphopeptides in each genetic subgroup in MM samples with and without MACS sorting. HRD sorted n = 35, HRD unsorted n = 25, HRDneg sorted n = 41, HRDneg unsorted n = 13; t(11.14) sorted n = 24, t(11.14) unsorted n = 3, t(11.14)neg sorted n = 52, t(11.14)neg unsorted n = 35; t(14.16) sorted n = 3, t(14.16) unsorted n = 1, t(14.16)neg sorted n = 73, t(14.16)neg unsorted n = 37; t(t4.14) sorted n = 11, t(t4.14) unsorted n = 8, t(t4.14)neg sorted n = 65, t(t4.14)neg unsorted n = 30; Boxplots show median (middle line), 25th and 75th percentiles, whiskers extend to minimum and maximum excluding outliers (values outside of 1.5*IQR). i: MM1S cells were sorted with CD138 + MACS and the global proteome and phosphoproteome were analyzed with label-free proteomics (n = 4, biological replicates). MACS-sorted samples were compared against the control with a moderated 2-sample t-test. No significant differences between MACS-sorted and non-sorted MM.1S cells were detected (< 0.05 FDR). Plots show results of moderated 2-sample t-test and correlation of averaged normalized intensities in both groups.

