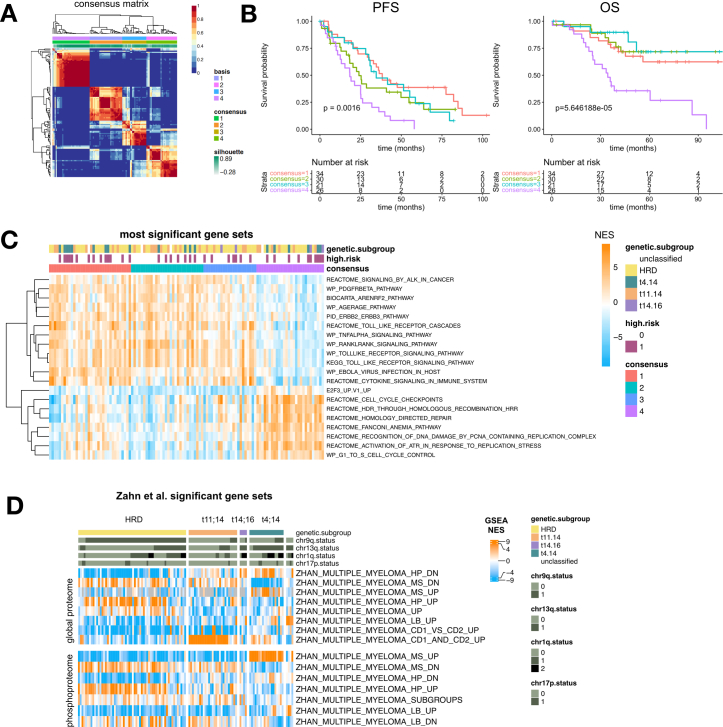
Extended Data Fig. 2. Unsupervised clustering of phosphoproteomic data.
a: SsGSEA normalized enrichment scores of phosphoproteomic data were used as input for non-negative matrix factorization (NMF) clustering. NMF consensus map is shown. b: Kaplan-Meier plots show progression-free survival (PFS) and overall survival (OS) of MM patients grouped by consensus cluster as shown in A. Survival in different groups was compared with a log-rank test. c: Gene sets of phosphoproteomic data most significantly different between consensus cluster 4 and other clusters (moderated t-test, the 20 most significant gene sets (FDR < 0.05) are shown). d: TMT ratios were analyzed with ssGSEA using the gene sets C2.all.v7.0.symbols.gmt, c6.all.v7.0.symbols.gmt and h.all.v7.0.symbols.gmt. Heatmaps display ssGSEA normalized enrichment scores (NES) of Zhan et al. gene sets significant between myeloma genetic subgroups (ANOVA; FDR < 0.14). Global proteome data (top) and phosphoproteome data (bottom) are shown.

