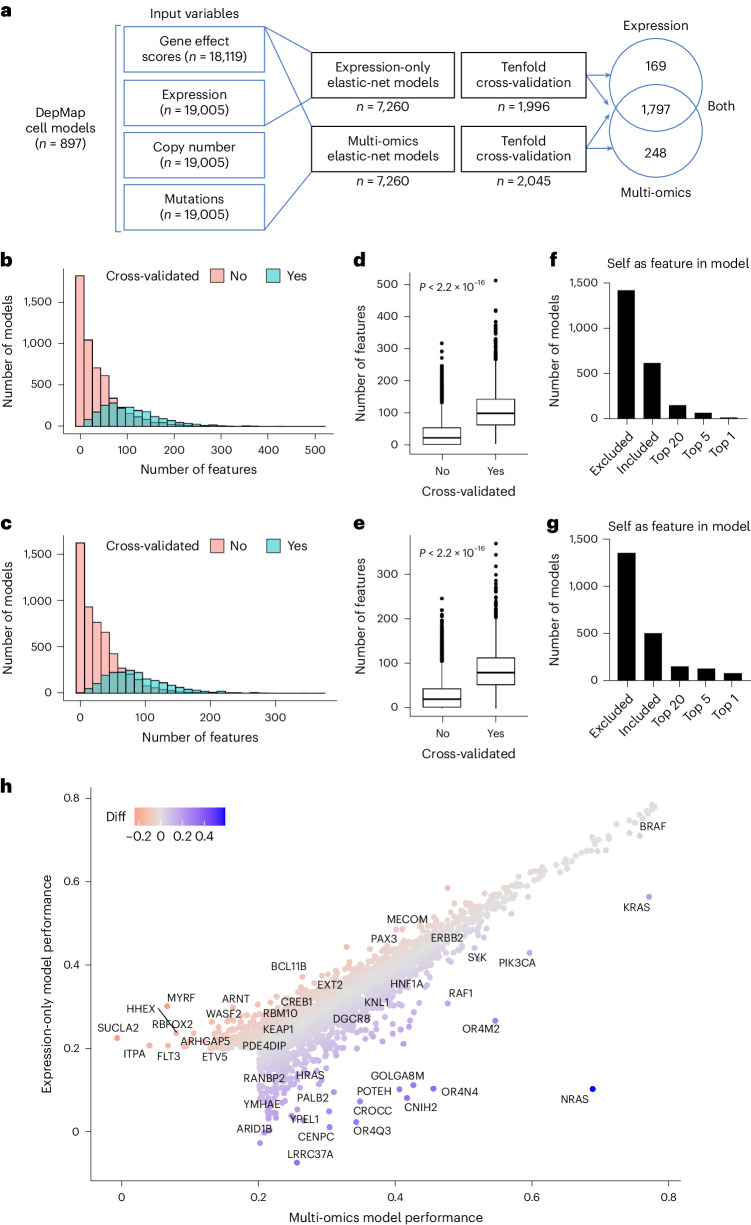
Fig. 1. Predictive modeling of gene essentiality in the DEPMAP.
a, Schematic of the elastic-net models for predictive modeling of gene essentiality in the DEPMAP using expression-only data or multi-omics data. Note the broad overlap in cross-validated models using expression-only or multi-omics data. b, Distribution of the number features per multi-omics model. c, Distribution of the number of features per expression-only model. d, Number of features per multi-omics model that passed (n = 2,045) or failed (n = 5,215) cross-validation based on a correlation coefficient of 0.2 threshold. e, Number of features per expression-only model that passed (n = 1,966) or failed (5,294) cross-validation based on a correlation coefficient of 0.2 threshold. For d and e, the center horizontal line represents the median (50th percentile) value. The box spans from the 25th to the 75th percentile. The whiskers indicate the fifth and 95th percentiles. f, Rank of the target gene (self) as a feature in the cross-validated multi-omics models. g, Rank of the target gene (self) as a feature in the cross-validated expression-only models. h, Comparison of model performance (correlation coefficients) of cross-validated models from multi-omics and expression-only data. Note for b–h that the performance and characteristics of multi-omics and expression-only models are very similar. P values indicated on graphs were determined by the Wilcoxon rank-sum test for two-group comparison (d and e).

