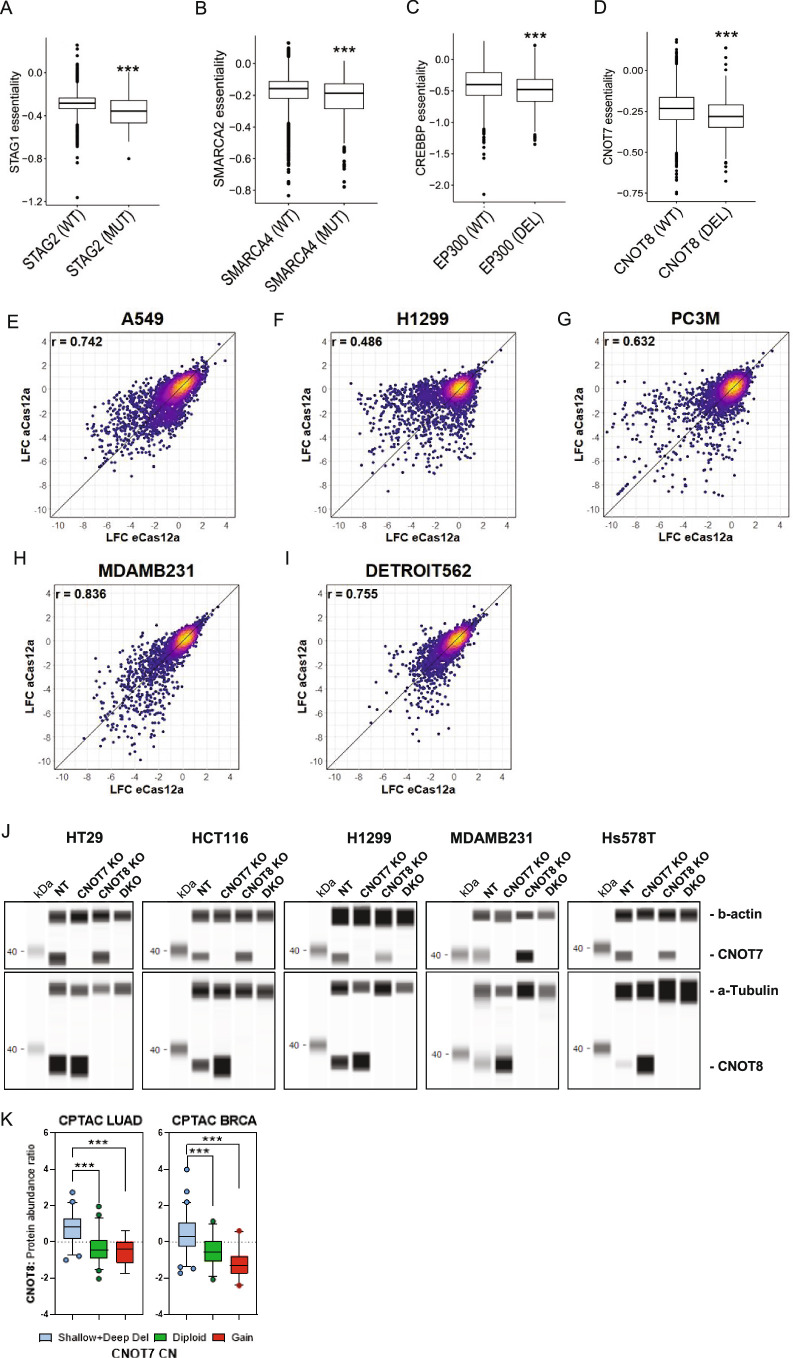
Extended Data Fig. 3. Characterization of synthetic lethalities.
(a) STAG1 synthetic lethality with STAG2 mutation (n = 163 for STAG2MUT and n = 7,418 for STAG2WT), (b) SMARCA2 synthetic lethality with SMARCA4 mutation (n = 223 for SMARCA4MUT and n = 7,358 for SMARCA4WT), (c) CREBBP synthetic lethality with EP300 mutation (n = 937 for EP300DEL and n = 6,644 for EP300WT), and (d) CNOT7 synthetic lethality with CNOT8 deletion are examples of synthetic lethalities that were detected by TCGADEPMAP. (n = 550 for CNOT8DEL and n = 7,031 for SMARCA4WT) ***P < 0.001, as determined by the Wilcoxon rank-sum test. (E-I) Comparison of multiplexed CRISPR/Cas12 screens performed using AsCas12a and EnAsCas12a enzymes. Analysis was performed using a Pearson’s correlation and coefficients (r) are displayed on the graphs. (j) Simple Western blots of protein expression of CNOT7, CNOT8 and housekeeping control Beta-Actin of nontargeting (NT) control, single (KO) and dual (DKO) knockout cells 3 days after CRISPR/RNP electroporation. (k) Plots showing the protein abundance ratio of CNOT8 (Y-axis) and copy number status of CNOT7 (X-axis) in the CPTAC Lung Adenocarcinoma (LUAD) and Breast Cancer (BRCA) cohorts showing a significant upregulation of CNOT8 protein in tumors with CNOT7 copy number loss (shallow and deep deletions) compared to diploid and gain tumors (for LUAD n = 7 for gain, n = 51 for diploid and n = 55 for shallow deletion; for BRCA n = 22 for gain, n = 33 for diploid and n = 67 for shallow deletion). For (A-D and K), the center horizontal line represents the median (50th percentile) value. The box spans from the 25th to the 75th percentile. The whiskers indicate the 5th and 95th percentiles. The two-sided Wilcoxon rank test was used for (A-D) ***p < 0.001 and ***p < 0.001 as determined by Student’s unpaired, two-tailed t-test for (K).

