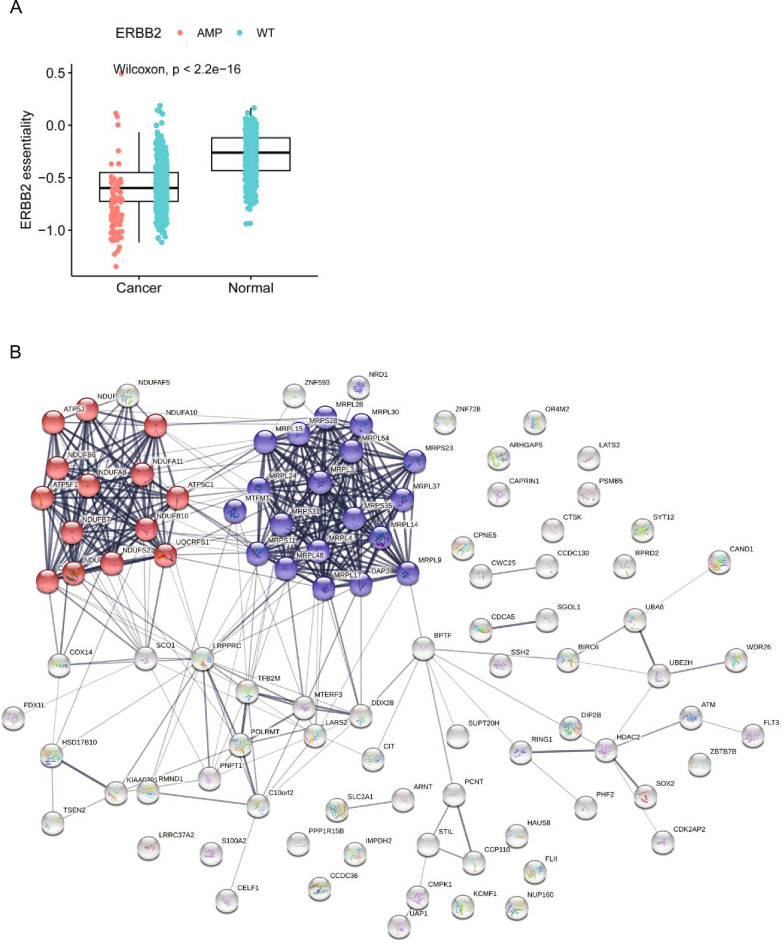
Extended Data Fig. 5. Essentiality profiles of genes in cancer versus normal tissues.
(a) ERBB2 essentiality is significantly higher in malignant breast cancer with ERBB2 amplifications (TCGADEPMAP, n = 137 for ERBB2AMP and n = 932 for ERBB2WT) compared with normal breast (GTEXDEPMAP, n = 459). ***P < 0.001, as determined by the Wilcoxon rank-sum test. For the boxplot, the center horizontal line represents the median (50th percentile) value. The box spans from the 25th to the 75th percentile. The whiskers indicate the 5th and 95th percentiles. (b) STRING network analysis of the top 100 LUAD targets with the greatest predicted tolerability in normal lung reveals significant connectivity (p < 1 × 10⁻¹⁶) and gene ontology enrichment for oxidative phosphorylation (blue colored spheres; p = 5.8 × 10⁻¹¹) and mitochondrial translation (red-colored spheres; p = 2.9 × 10⁻²⁰).

