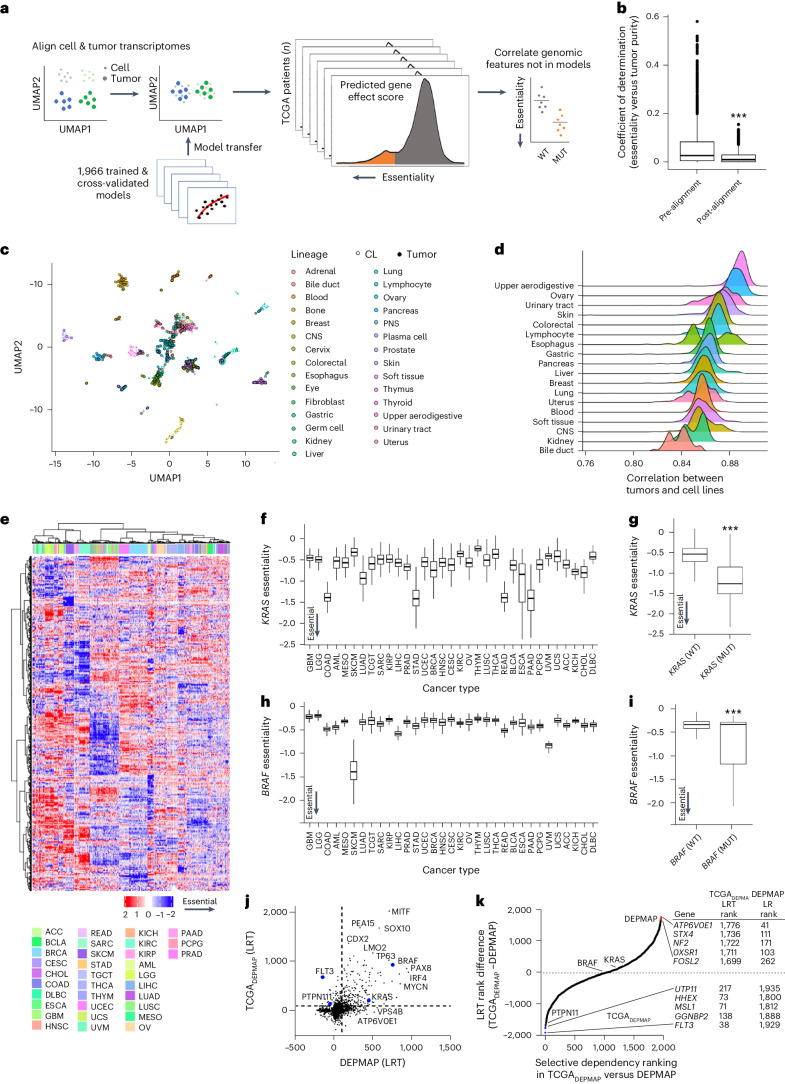
Fig. 2. Building a translational dependency map: TCGADEPMAP.
a, Schematic of gene essentiality model transposition from DEPMAP to TCGA, following alignment of genome-wide expression data to account for differences in homogeneous cultured cell lines and heterogenous tumor biopsies with stroma. b, Coefficient of determination (R2) of the cross-validated gene essentiality models and tumor purity before (n = 1,966) and after transcriptional alignment (n = 1,966). The center horizontal line represents the median (50th percentile) value. The box spans from the 25th to the 75th percentile. The whiskers indicate the fifth and 95th percentiles. A two-sided Wilcoxon rank-sum test was performed to test for statistical significance. c, Uniform Manifold Approximation and Projection (UMAP) visualization of normalization of genome-wide transcriptomes improves alignment between cultured cells and patient tumor biopsies with contaminating stroma. d, Correlation coefficients of essentiality profiles of different lineages of cultured cell models and TCGA patient tumors. e, Unsupervised clustering of predicted gene essentiality scores across TCGADEPMAP revealed strong lineage dependencies. Blue indicates genes with stronger essentiality and red indicates genes with less essentiality. f, KRAS dependency was enriched in TCGADEPMAP lineages (n = 9,593) with high frequency of KRAS GOF mutations, including colon adenocarcinoma (COAD), LUAD, STAD, READ, esophageal carcinoma (ESCA) and PAAD. g, KRAS essentiality correlated with KRAS mutations in all TCGADEPMAP lineages (n = 532 for KRASmut and n = 7,049 for KRASwt). h, BRAF dependency in TCGADEPMAP (n = 9,593) was enriched in SKCM, which has a high frequency of GOF mutations in BRAF. i, BRAF essentiality correlated with BRAF mutations in all TCGADEPMAP lineages (n = 559 for BRAFmut and n = 7,022 for BRAFwt). For f–i, the center horizontal line represents the median (50th percentile) value. The box spans from the 25th to the 75th percentile. The whiskers indicate the fifth and 95th percentiles. For g–i, a two-sided Wilcoxon rank-sum test was performed to test for statistical significance. j, Scatter-plot of model selectivity in TCGADEPMAP and DEPMAP, as determined by normality likelihood (NormLRT). k, Ranking of model selectivity between in TCGADEPMAP and DEPMAP, as determined by the NormLRT scores. ***P < 0.001, as determined by the Wilcoxon rank-sum test for two-group comparison and Kruskal–Wallis followed by Wilcoxon rank-sum test with multiple test correction for the multi-group comparison. CNS, central nervous system; PNS, peripheral nervous system; ACC, adrenocortical carcinoma; BLCA, bladder urothelial carcinoma; CESC, cervical and endocervical cancers; CHOL, cholangiocarcinoma; GBM, glioblastoma multiforme; HNSC, head and neck squamous cell carcinoma; KIRC, kidney renal clear cell carcinoma; KIRP, kidney renal papillary cell carcinoma; LGG, lower-grade glioma; LIHC, liver hepatocellular carcinoma; MESO, mesothelioma; OV, ovarian serous cystadenocarcinoma; PRAD, prostate adenocarcinoma; SARC, sarcoma; TGCT, testicular germ cell tumors; THCA, thyroid carcinoma; THYM, thymoma; UCEC, uterine corpus endometrial carcinoma; UCS, uterine carcinosarcoma; UVM, uveal melanoma.

