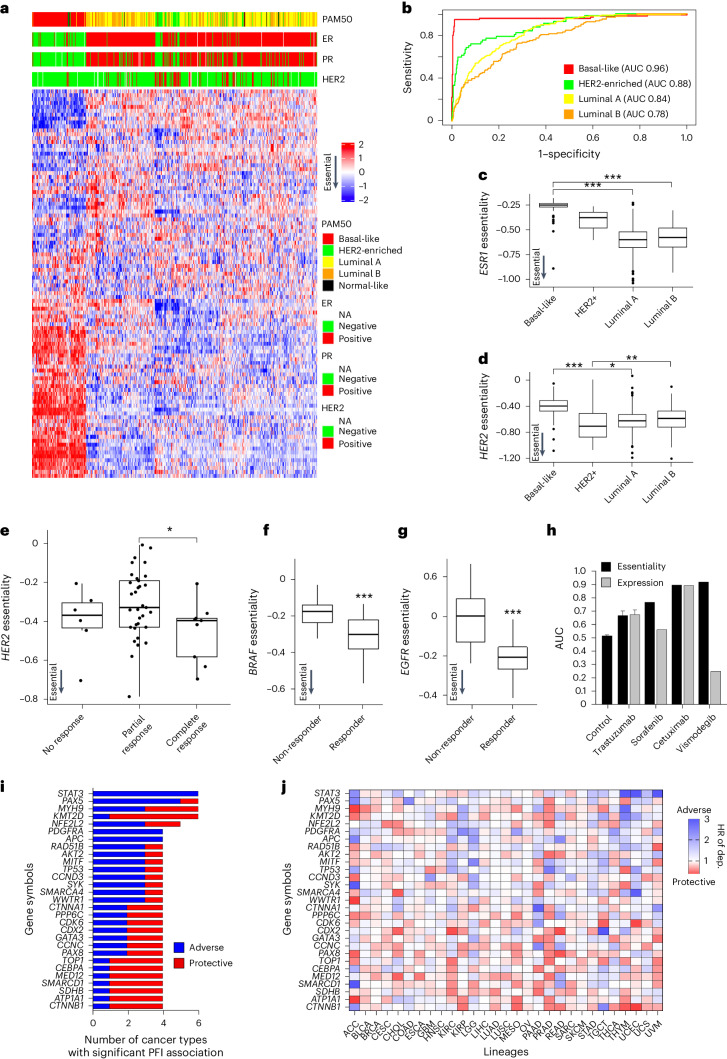
Fig. 3. Translating TCGADEPMAP to clinically relevant phenotypes and outcomes.
a, Unsupervised clustering of the top 100 dependencies in TCGA breast cancer patients. b, A ROC–AUC analysis was used to test the accuracy of calling breast cancer subtypes using the top 100 dependencies. c, ESR1 dependencies are strongest in ER-positive luminal BRCA (n = 96 for basal-like, n = 57 for HER2+, n = 231 for luminal A, n = 126 for luminal B and n = 7 for normal-like). d, HER2 dependencies are strongest in HER2-amplified BRCA (n = 96 for basal-like, n = 57 for HER2+, n = 231 for luminal A, n = 126 for luminal B and n = 7 for normal-like) e, HER2 dependency predicts trastuzumab response in patients with BRCA (n = 6 for no response, n = 33 for partial response and n = 9 for complete response). f, BRAF dependency predicts sorafenib response in patients with hepatocellular cancer (n = 46 for non-responder and n = 21 for responder). g, EGFR dependency predicts cetuximab response in patients with head and neck cancer (n = 26 for non-responder and n = 14 for responder). For c–g, *P < 0.05, **P < 0.01 and ***P < 0.001, as determined by the Wilcoxon rank-sum test for two-group comparison and Kruskal–Wallis test followed by a Wilcoxon rank-sum test with multiple test correction for the multi-group comparison. For boxplots in c–g, the center horizontal line represents the median (50th percentile) value. The box spans from the 25th to the 75th percentile. The whiskers indicate the 5th and 95th percentiles. h, AUC values for drug response predictions based on essentiality, expression and random essentiality scores generated via random sampling (control). i, Top gene essentialities associated with the PFI by univariate Cox proportional hazard regression model across multiple lineages in TCGADEPMAP (Benjamini–Hochberg, FDR < 0.2). j, HRs of the top essentialities across TCGADEPMAP. Blue indicates a greater dependency associated with worse outcome and red indicates a greater dependency is associated with better outcome. P values and HRs are shown in Supplementary Table 9.

