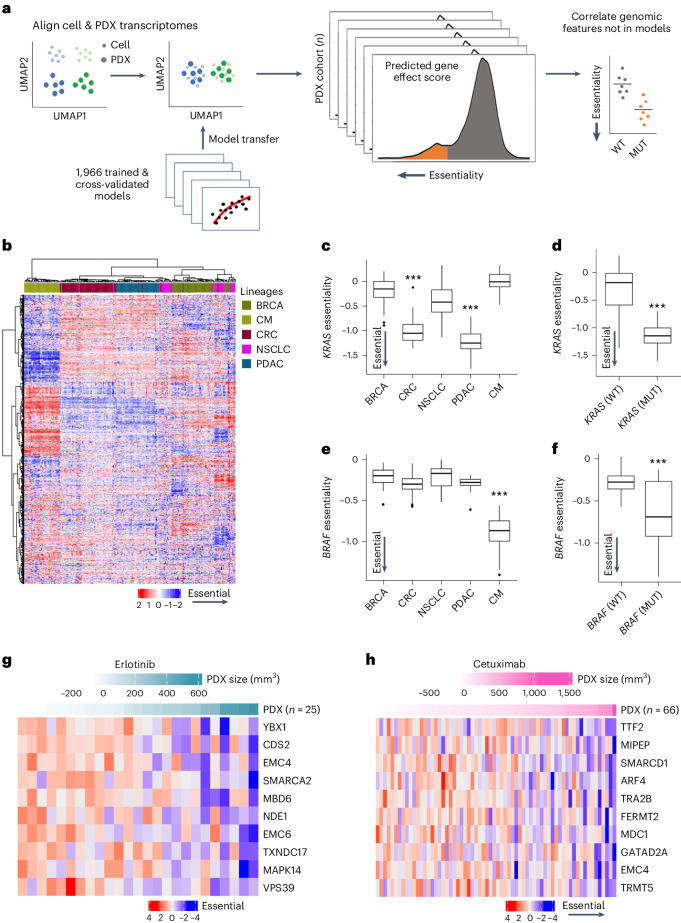
Fig. 6. Building a translational dependency map in patient-derived xenografts: PDXEDEPMAP.
a, Schematic of gene essentiality model transposition from DEPMAP to PDXE, following alignment of genome-wide expression data to account for differences in homogeneous cultured cell lines and PDX samples with contaminating stroma. b, Unsupervised clustering of predicted gene essentiality scores across five lineages in PDXEDEPMAP confirmed similar lineage drivers of gene dependencies, as observed in TCGADEPMAP. Blue indicates genes with stronger essentiality and red indicates genes with less essentiality. c, KRAS dependency was enriched in PDXEDEPMAP lineages with high frequency of KRAS GOF mutations, including CRC and PDAC. n = 43 for BRCA, n = 51 for CRC, n = 27 for NSCLC, n = 39 for PDAC and n = 32 for CM. d, KRAS essentiality correlated with KRAS mutations in all PDXEDEPMAP lineages (n = 74 for KRASmut and n = 117 for KRASwt). e, BRAF dependency in PDXEDEPMAP was enriched in CM, which has a high frequency of GOF mutations in BRAF. n = 43 for BRCA, n = 51 for CRC, n = 27 for NSCLC, n = 39 for PDAC and n = 32 for CM. f, BRAF essentiality correlated with BRAF mutations in all TCGADEPMAP lineages (n = 32 for BRAFmut and n = 159 for BRAFwt). For c–f, the center horizontal line represents the median (50th percentile) value. The box spans from the 25th to the 75th percentile. The whiskers indicate the fifth and 95th percentiles. g, Top correlated gene essentiality models that correlate with PDX response to erlotinib in PDXEDEPMAP. h, Top correlated gene essentiality models that correlate with PDX response to cetuximab in PDXEDEPMAP. ***P < 0.001, as determined by the Wilcoxon rank-sum test for two-group comparison (d and f) and Kruskal–Wallis test followed by a Wilcoxon rank-sum test with multiple test correction for a multi-group comparison (c and e). NSCLC, non-small cell lung cancer.

