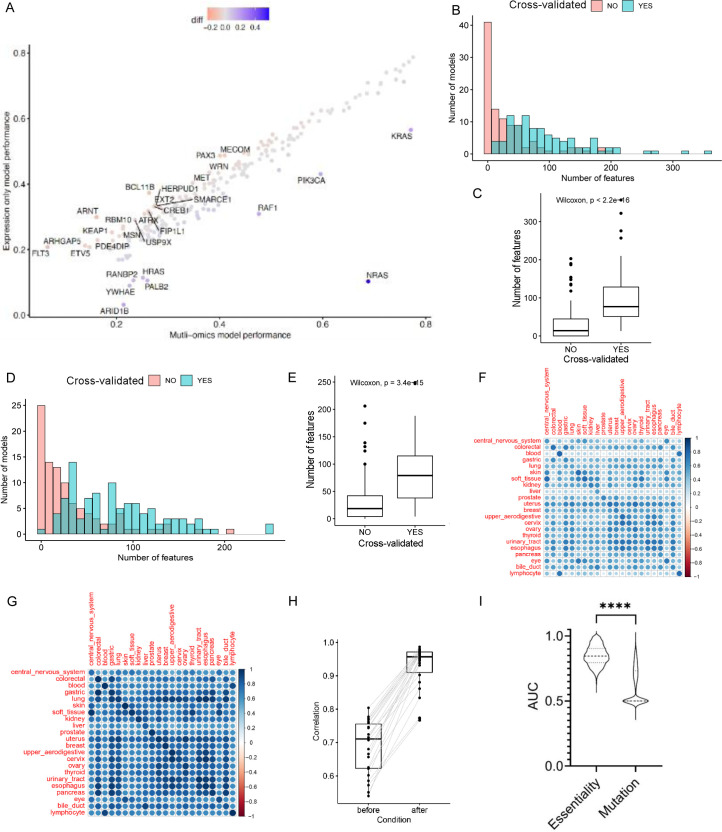
Extended Data Fig. 1. The characteristics of gene essentiality models before and after transcriptional alignment cell models and patient tumor biopsies.
(a) The performances of expression-only and multi-omics models of gene essentiality were compared across 103 annotated oncogenes. Note the strong correlation of expression-only and multi-omics models with a few notable outliers, such as NRAS, FLT3 and ARNT. (b) The distribution of the number of features for the multi-omics models for the 103 annotated oncogenes. (c) The number of features per multi-omics model for the 103 annotated oncogenes that passed (n = 95) or failed (n = 102) cross-validation. (d) The distribution of the number of features per expression-only models for the 103 annotated oncogenes. (e) The number of features per expression-only model for the 103 annotated oncogenes that passed (n = 101) or failed (n = 96) cross-validation. Note similarities in the characteristics and performances of multi-omics and expression-only models, and that only 7% of the multi-omics models significantly outperformed the expression-only models in the cross-validation while 84% were comparable when applying a cutoff of 0.05 correlation coefficient difference between models as a meaningful improvement in performance. As a reference using the same criteria 15% of multi-omics models outperformed expression-based models and 76% were comparable when we used the whole set of 2,211 models. (f, g) The heatmaps show the Pearson correlation between the gene expression of DepMap and TCGA before (f) and after (g) expression alignment by identification and removal of the most variant signatures (cPC1–4; that is, stromal signatures) before elastic-net ML. The rows are TCGA lineages and columns are DepMap lineages. (h) Shows that the correlation of expression for the same lineage (n = 22) in TCGA and DepMap is significantly improved by our expression alignment pipeline. (i) Comparison of expression-only elastic-net models for gene essentiality and gene mutational status (n = 890). To make performance metrics (AUC) comparable with binary mutational status, the essentiality scores were binarized using a –0.5 essentiality score as a cutoff. To calculate the accuracy of predicting dependencies and mutations, elastic-net machine learning was run to predict mutations and essentiality using the same settings and expression data for 891 genes with mutations at >2% prevalence in TCGADEPMAP patients. Of note, the elastic-net models were allowed to select the most informative predictive features for mutation and essentiality for each gene, as the best predictors for essentiality may not be the best features to predict mutation. For (C,E,H,I), the center horizontal line represents the median (50th percentile) value. The box spans from the 25th to the 75th percentile. The whiskers indicate the 5th and 95th percentiles. The two-sided Wilcoxon rank test was used for (C,E,H) and for (I) ****P < 0.0001 by Student unpaired t-test.

