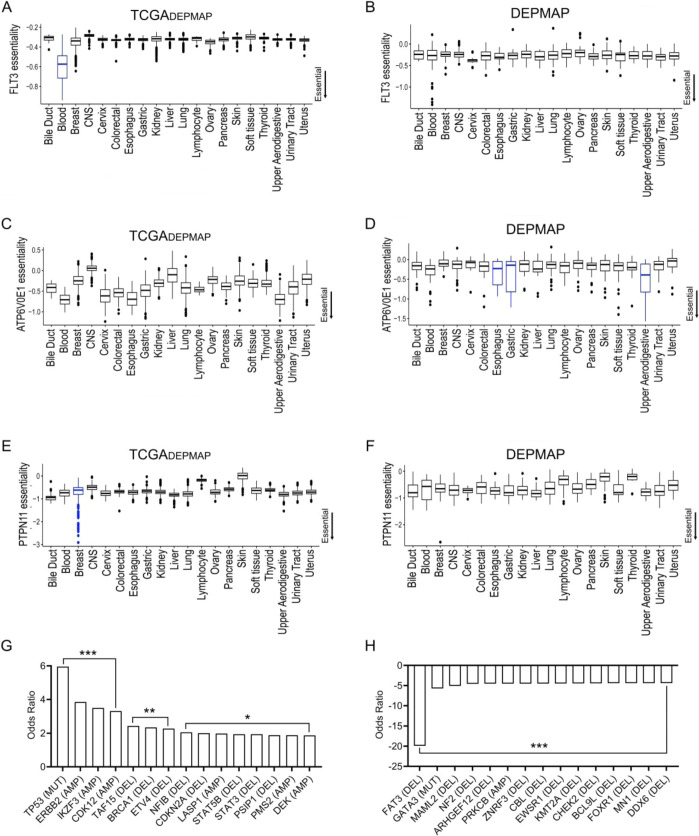
Extended Data Fig. 2. Examples of dependencies with different selectivity profiles across TCGADEPMAP and DEPMAP cohorts.
(a) FLT3 was classified as a strongly selective dependency (SSD) with markedly higher dependency in blood lineage cancers of TCGADEPMAP (blue bar, n = 7,021), (b) whereas FLT3 showed higher dependency in some blood lineage cancers but does not meet the threshold of an SSD in DEPMAP (n = 810). (c) ATPV6V0E1 essentiality scores varied widely across TCGADEPMAP (n = 7,021), (d) while ATPV6V0E1 was classified as an SSD that was restricted to only a few lineages in DEPMAP (blue bars, n = 810). (e) PTPN11 was classified as an SSD with very strong dependencies in a subset of breast cancer patients in TCGADEPMAP (blue bar, n = 7,021), (f) whereas no selectivity of PTPN11 essentiality was detected in DEPMAP (n = 810). For (A-F), the center horizontal line represents the median (50th percentile) value. The box spans from the 25th to the 75th percentile. The whiskers indicate the 5th and 95th percentiles (g) Top cancer driver mutations enriched in TCGADEPMAP breast cancer patients that were highly dependent on PTPN11. (h) Top cancer driver mutations depleted in TCGADEPMAP breast cancer patients that were highly dependent on PTPN11. For (g, h), ***FDR < 0.01, **P < 0.01, and *P < 0.05, as determined by Fisher exact test.

