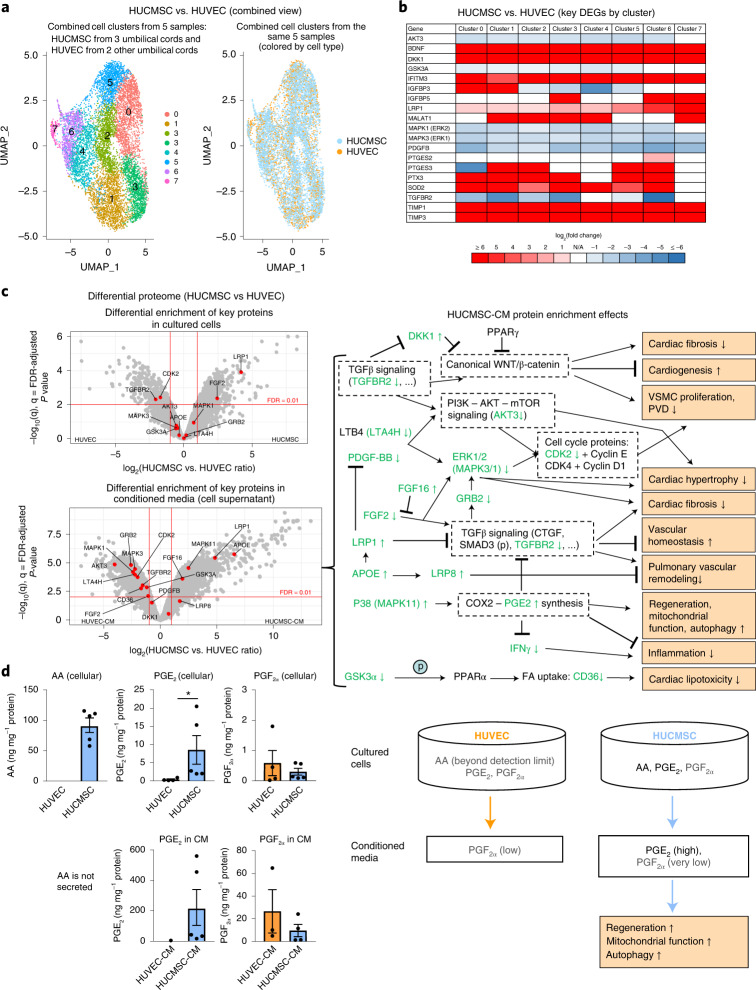
Fig. 3. Comprehensive analysis of cultured cells and CM (single-cell transcriptome, proteome and prostaglandins) reveals potential mechanisms explaining regenerative effects of HUCMSC-CM.
a, Single-cell RNA expression analysis identified eight cell clusters with distinct expression profiles common to both HUCMSC and HUVEC cells. These clusters were used for differential gene expression analysis (HUCMSC versus HUVEC). Sample sizes: HUCMSC, n = 3 (passage 6); HUVEC, n = 2 (passage 6). All cords were harvested from unrelated donors. b, The heat map of the key genes potentially contributing to regenerative effects of HUCMSCs in all eight clusters shown in a. Selection of these genes was based on (1) scRNA-seq analysis of the HUCMSCs whose CM was used in treatment of the case; (2) results of the proteomics analysis shown in c; and (3) association with synthesis of PGE2 (the prostaglandin known for its regenerative capacity). c, The volcano plots depict distribution of differentially enriched proteins (HUCMSC, n = 5 versus HUVEC, n = 4). The key proteins relevant to the regenerative potential are shown as red dots. The proteins above the FDR threshold (<0.01) and passing the effect size threshold (0.5 > HUCMSC versus HUVEC ratio > 2) were considered significant. Concentrations of CM proteins deviated from their levels in cultured cells (in most cases, increasing the degree of differential enrichment). On the right panel, we show potential effects of enrichment of the key proteins in the CM. Proteins shown in green were observed in our data and correspond to the proteins labeled in the volcano plot (↑ = upregulation, ↓ = downregulation, (p) = phosphorylation, bold font indicates FDR-adjusted P < 0.01). The right panel depicts likely HUCMSC-CM protein enrichment effects. d, LC–MS prostaglandin analysis revealed that the primary difference between HUCMSC (n = 5) and HUVEC (n = 4) samples was in the significantly higher HUCMSC levels of PGE2 (both in cells and CM) and higher levels of AA in HUCMSCs, whereas the HUVEC AA levels were below the detection limit. Because AA is a precursor of PGE2, the upregulation of PGE2 in HUCMSCs (P = 0.0159) is likely associated with the higher HUCMSC AA level. Notably, PGE2 greatly contributes to the paracrine regenerative and immunomodulatory effects of MSCs in preclinical in vivo and in vitro studies (for example, PGE2-induced suppression of IFN-γ and TGFβ signals). Trace amounts of PGF2α were also detected without significant enrichment in either of the groups. The values in bar plots values are expressed as mean ± SEM; two-tailed Mann–Whitney U-test was used (*P < 0.05 and **P < 0.01). DEG, differentially expressed gene.

