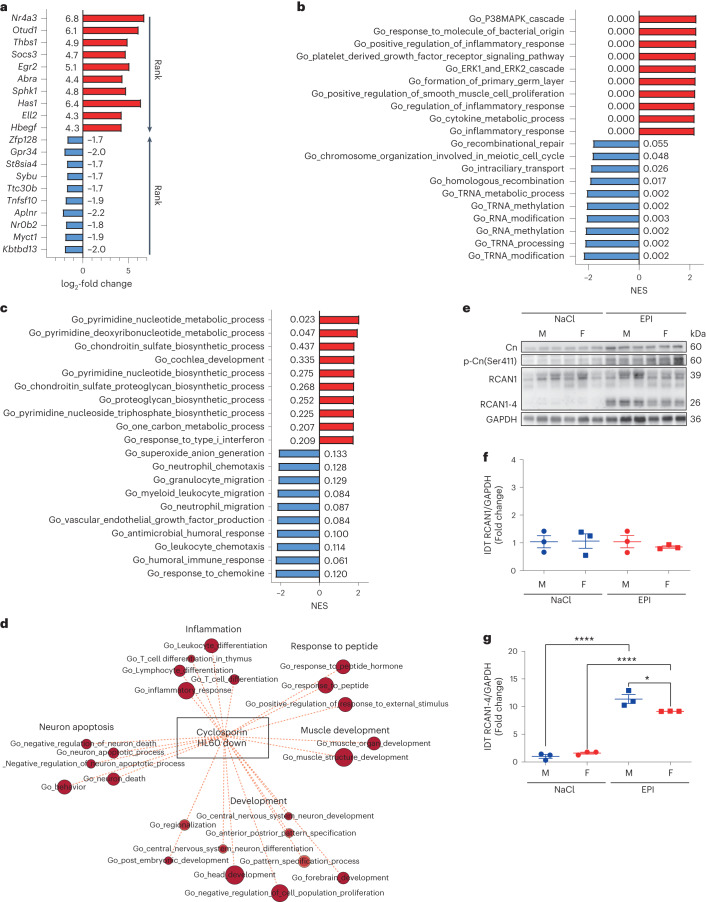
Fig. 3. Sex-specific calcineurin-driven inflammation.
a–c, GSEA from RNA sequencing performed in left ventricular tissue of 10-week-old mice treated with NaCl and EPI. a, log2-fold change of top-ranked upregulated (red) and downregulated (blue) genes of male mice treated with NaCl (n = 5) vs. EPI (n = 7) 2 h after the injection. b, Normalized enrichment score (NES) and false discovery rate (FDR (numbers next to bars)) of top-ranked upregulated (red) and downregulated (blue) enriched gene set ontology (GO) biological pathways of male mice treated with NaCl (n = 5) versus EPI (n = 7). c, NES and FDR of top-ranked upregulated (red) and downregulated (blue) enriched GO biological pathways of female (n = 7) versus male (n = 7) mice 2 h after EPI. d, Enrichment map illustrating discrepantly regulated overlapping myocardial pathways, upregulated in male mice treated with EPI and downregulated by the calcineurin inhibitor CsA, based on the Tanlab drug signature database gene set Cyclosporin_HL60_DOWN (P = 0.0174). e, Immunoblotting of calcineurin (Cn), serine 411-phospho-Cn (p-Cn(Ser411)), RCAN1 and RCAN1-4, as well as GAPDH from left ventricular tissue 2 h after NaCl or EPI in male versus female mice. f,g, Immunoblotting integrated density (IDT) protein quantification of RCAN1/GAPDH (f) and RCAN1-4/GAPDH (g) (n = 3 in each group, *P = 0.021, ****P < 0.0001). Data expressed as mean ± s.e.m., from multiple comparisons adjusted ANOVA or two-sided Mann–Whitney U-test (d).

