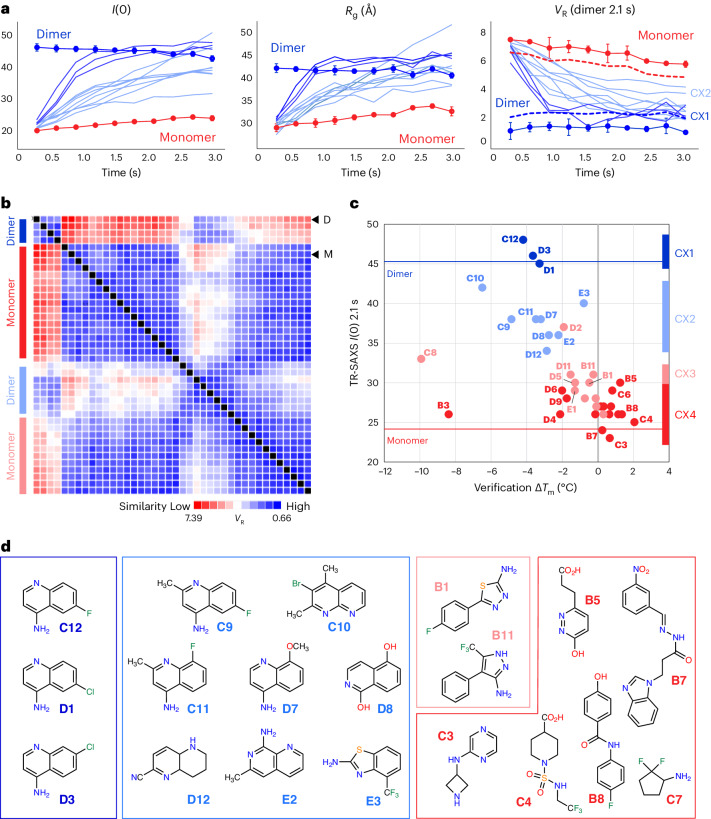
Fig. 2. TR-HT-SAXS triages hits by conformational impact and fragment chemotype.
a, I(0), Rg and VR (AIF–NADH–DMSO dimer reference) values from select time-resolved GL2500 SAXS datasets compared to AIF monomer (connected red circles) and NADH dimer (connected blue circles) DMSO benchmarks. GL2500 curves are colored by similarity cluster from b: dark blue, CX1; light blue, CX2. Error bars for AIF monomer and dimer controls represent standard deviations from two independent replicates (three replicates for AIF–NADH I(0) and Rg). Dotted lines represent AIF monomer and dimer VR significance thresholds of three times the average standard deviation across the time series. b, Clustered GL2500 SAXS VR similarity matrix at 2.1 s. High similarity is indicated in blue, whereas low similarity is indicated in red according to the VR scale bar. Arrows indicate the row position of AIF dimer (D) or monomer (M) controls. c, Extrapolated I(0) values from 2.1-s GL2500 SAXS datasets plotted against ΔTm from the secondary DSF assay. Data points are color coded by SAXS similarity cluster from b. d, GL2500 similarity clusters reveal SAXS-triaged chemotypes. Displayed CX3 and CX4 fragments exhibited the greatest response in the DSF and MST verification assays: dark blue, CX1; light blue, CX2; light red, CX3; dark red, CX4.

