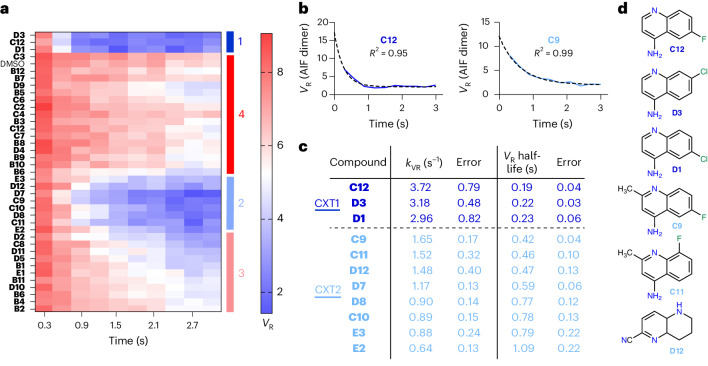
Fig. 3. TR-SAXS kinetic analysis extends SAXS chemotype SAR.
a, GL2500 SAXS VR heat map capturing time-resolved VR values of AIF–ligand complexes calculated with reference to the AIF dimer benchmark at 2.1 s. High similarity is indicated in blue, whereas low similarity is indicated in red according to the VR scale bar. Clustered chemotype classes (CX1–CX4) described in Fig. 2 are indicated on the right. b, Exemplary exponential fits to VR transition curves for AIF–C12 and AIF–C9 complexes. c, CXT1 (dark blue) and CXT2 (light blue) compounds kinetically ranked and clustered by VR transition rates, kVR. d, The 4-aminoquinoline scaffold stimulates the fastest dimer transition rates among the GL2500 hits.

