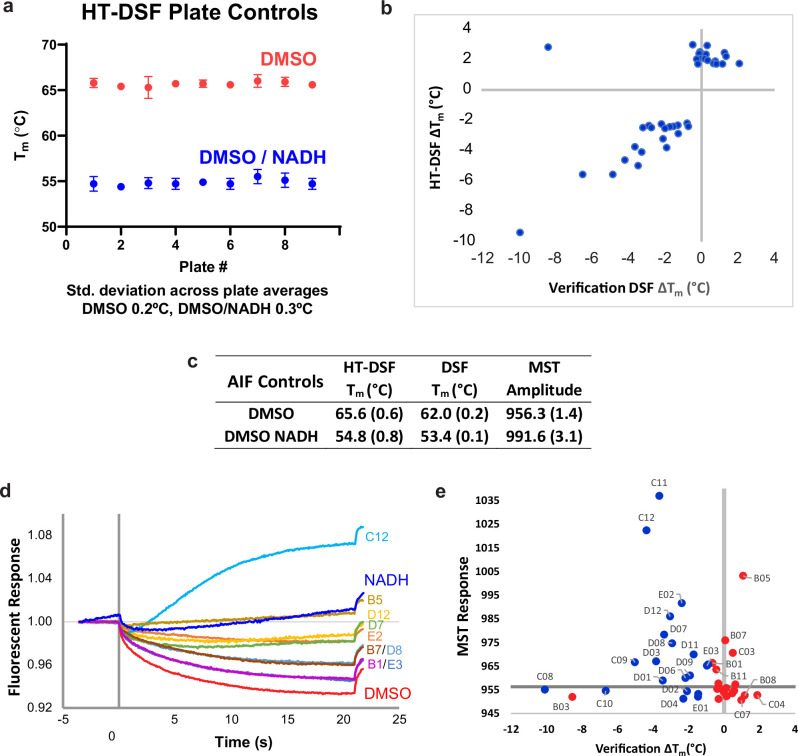
Extended Data Fig. 1. AIF HT-DSF GL2500 screening and fragment verification.
(a) Plate-to-plate variation in AIF Tm with DMSO or DMSO/NADH controls. Each point represents the average of 24 wells within the indicated plate; error bars are standard deviations. (b) Comparison of Tm shifts from high-throughput and verification DSF screens for the top 39 fragments hits. (c) Melting temperatures and reference MST amplitudes for AIF screening controls. Standard deviations in parentheses are from 216 (HT-DSF), 6 (DSF), or 4 (MST) replicate measurements. (d) Exemplary MST traces from positive fragment binders. (e) Full-view Tm v MST response plot.

